IMAGE

Fig. 1.

ID
ZDB-IMAGE-230617-17
Source
Figures for Ezhkova et al., 2023
Image
Figure Caption

Fig. 1.

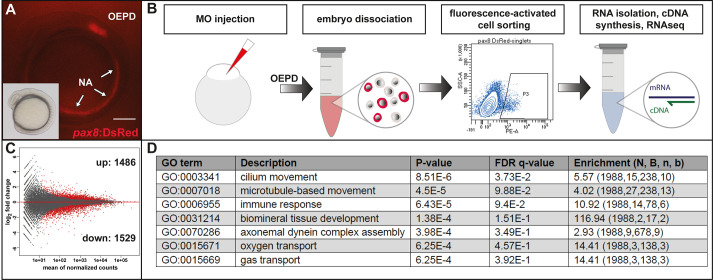
Transcriptome analysis identifies genes regulated by Dlx3b/4b. (A) Expression of pax8:DsRed in the otic-epibranchial progenitor domain (OEPD) and the nephric anlagen (NA) at the eight-somite stage (13 hpf). Lateral view. Scale bar: 250 µm. (B) Schematic illustration of the experimental procedures. Following dlx3b/4b morpholino injection at the one-cell stage, wild-type and dlx3b/4b morpholino-injected embryos were dissociated at late OEPD stages (12-13.5 hpf) followed by fluorescence-activated cell sorting. Subsequently, isolated transcripts from sorted, pax8:DsRed-positive cells were reverse transcribed into cDNA and used for transcriptome analysis (RNAseq). (C) Comparison of wild-type versus Dlx3b/4b-depleted samples with a false discovery rate of 10% revealed 3015 differentially expressed genes. 1486 and 1529 genes were up- and downregulated respectively. (D) Gene ontology (GO) analysis of the differentially expressed genes using the GOrilla gene ontology analysis tool (Eden et al., 2009). For more information see Material and Methods.

Acknowledgments
This image is the copyrighted work of the attributed author or publisher, and ZFIN has permission only to display this image to its users. Additional permissions should be obtained from the applicable author or publisher of the image. Full text @ Biol. Open