IMAGE

Figure 2

ID
ZDB-IMAGE-230609-12
Source
Figures for Grabinski et al., 2023
Image
Figure Caption

Figure 2

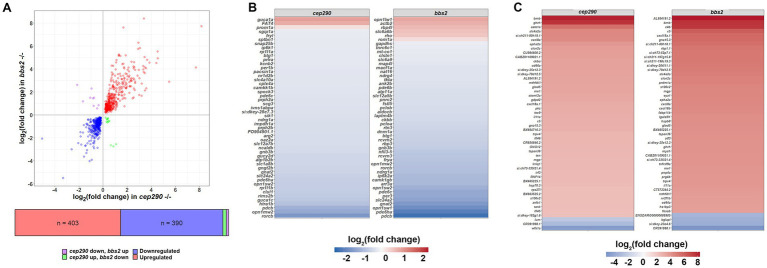
Enrichment of differentially expressed genes in biological processes of interest in cep290 and bbs2 mutants. (A) Log/log plot of DEG fold changes of common DEGs in cep290−/− and bbs2−/− datasets. Blue circles represent downregulated DEGs. Red circles represent common upregulated DEGs. Purple circles are DEGs upregulated in bbs2−/− retina but downregulated in cep290−/− retinas. Green circles are DEGs downregulated in bbs2−/− retinas but upregulated in cep290−/− retinas. (B) Heat map of the log2 fold change in the top 50 most abundantly expressed of the 815 DEGs in common by read count. Most DEGs were downregulated. (C) Heat map of the log2 fold change in the top 50 DEGs with greatest fold change in expression.

Acknowledgments
This image is the copyrighted work of the attributed author or publisher, and ZFIN has permission only to display this image to its users. Additional permissions should be obtained from the applicable author or publisher of the image. Full text @ Front. Mol. Neurosci.