
|
Figure 2
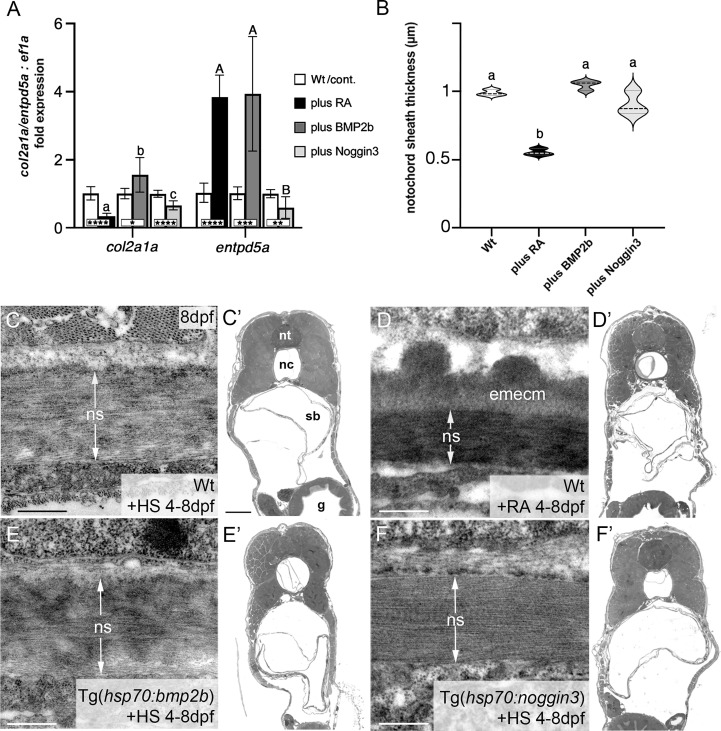
BMP has no major impact on col2a1 expression and notochord sheath formation. (A) qPCR results for the matrix-generating gene col2a1a and the matrix-mineralizing gene entpd5a after RA exposure, BMP2b or Noggin3 overexpression, respectively. See main text for exact experimental conditions. Each shaded column indicates the ratio of expression levels between an experimental group and its specific control group set to a value of 1 (white columns), with the respective statistical significances determined via Student’s t-test with Welch’s correction and indicated as * (significant with p<0.05), ** (significant with p<0.01), *** (significant with p<0.001) and **** (significant with p<0.0001). In addition, the letter subscript system (small letters for col2a1a; capital letters for entpd5a) is used to indicate significances of differences between the different experimental groups, with groups with the same letters being not significantly different according to Brown-Forsythe and Welch ANOVA tests (p < 0.0001) with post-hoc Dunnett’s T3 multiple comparison test (p < 0.05). (B) Quantitative analysis of notochord sheath thickness, based on measurements performed on TEM specimens as in (C–F). Listed conditions have been obtained via drug treatment (RA) or by the aforementioned heat-shock inducible transgenes; violin plots of N=3 biological samples per condition from independent spawnings/treatments, with each N representing the mean value from 5 different sections per specimen; broken and dotted lines indicate mean and quartiles, respectively; experimental groups labeled with identical superscript letters are not significantly different according to Student’s t-test with Welch’s correction, p < 0.05. (C–F) TEM micrographs of cross-sections through the abdominal notochord sheath from larvae with genotypes and treatments as indicated; differences in the darkness of the notochord sheath are due to differences in its mineralization levels in the different conditions. (C’–F’) show overviews of the corresponding semithin-sections indicating that the TEM images were taken at corresponding positions along the antero-posterior axis of the specimens. Scale bars: 0.5 µm (C–F), 50 µm (C’); g, gut; nc, notochord; ns, notochordal sheath; nt, neural tube; emecm, external mineralized extracellular matrix; sb, swim bladder.