
|
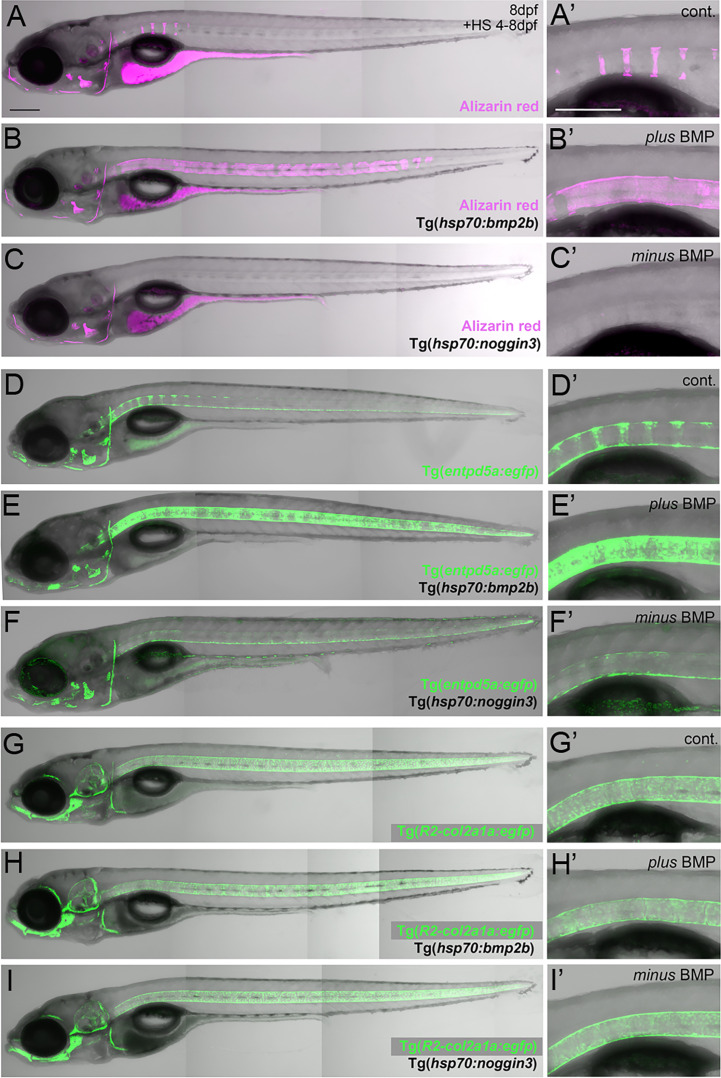
Figure 1
BMP regulates mineralization and entpd5a expression along the notochord. (A–I) Lateral views of zebrafish larvae shown in merged transmitted and fluorescent light channels with tissue staining and genotypes as indicated at an age of 8dpf. Alizarin red labels mineralized extracellular matrix (ECM) in magenta (A–C). entpd5a-expressing cells are visualized by Tg(entpd5a:egfp) in green (D–F), col2a1-expressing chondroblasts and chordoblasts by Tg(R2-col2a1a:egfp) in green (G–I). Magnified views of the region right dorsal to the swim bladder from corresponding larvae are shown in A’ o I’. All larvae have been heat-shocked once a day for 45 minutes at 40°C from 4-8 dpf. Note the ventral line of chordoblasts along the entire length of the notochord that remained EGFP positive after noggin3 overexpression (F, F’), pointing to BMP-independent regulation in this particular notochordal subdomain. Scale bars: 200 µm.