
|
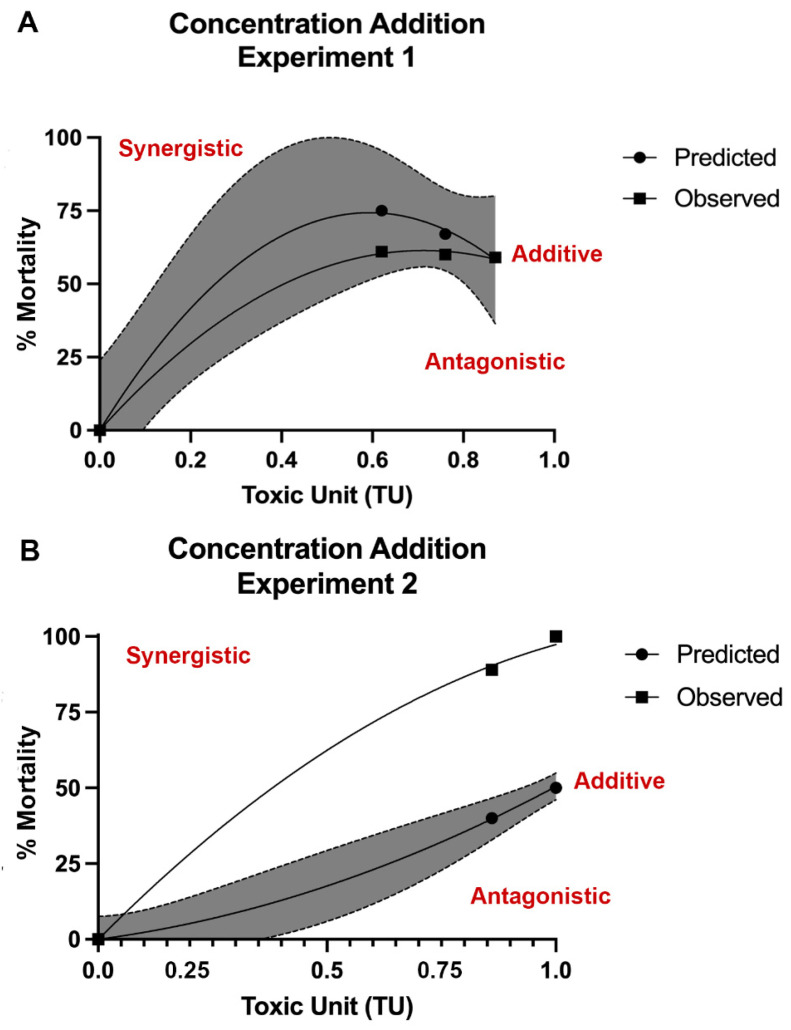
Fig. 6
Observed and predicted mortality using the concentration addition (CA) model. Developing zebrafish were exposed to the metal mixtures from 1 to 120 h post fertilization (hpf) and mortality recorded. Results were compared to predicted mortality based on CA models when the Pb LC25 (39.0 ppm, mg/L) concentration was held constant (A) or when the Pb LC50 (73.76 ppm) concentration was held constant (B). Similarity of predicted and observed curves indicates additive interaction (within in shaded region) (A), where upper deviation from predicted curve suggests synergistic response (B). N = 3 biological replicates per treatment group with 50 subsamples per biological replicate.