
|
Fig. 5
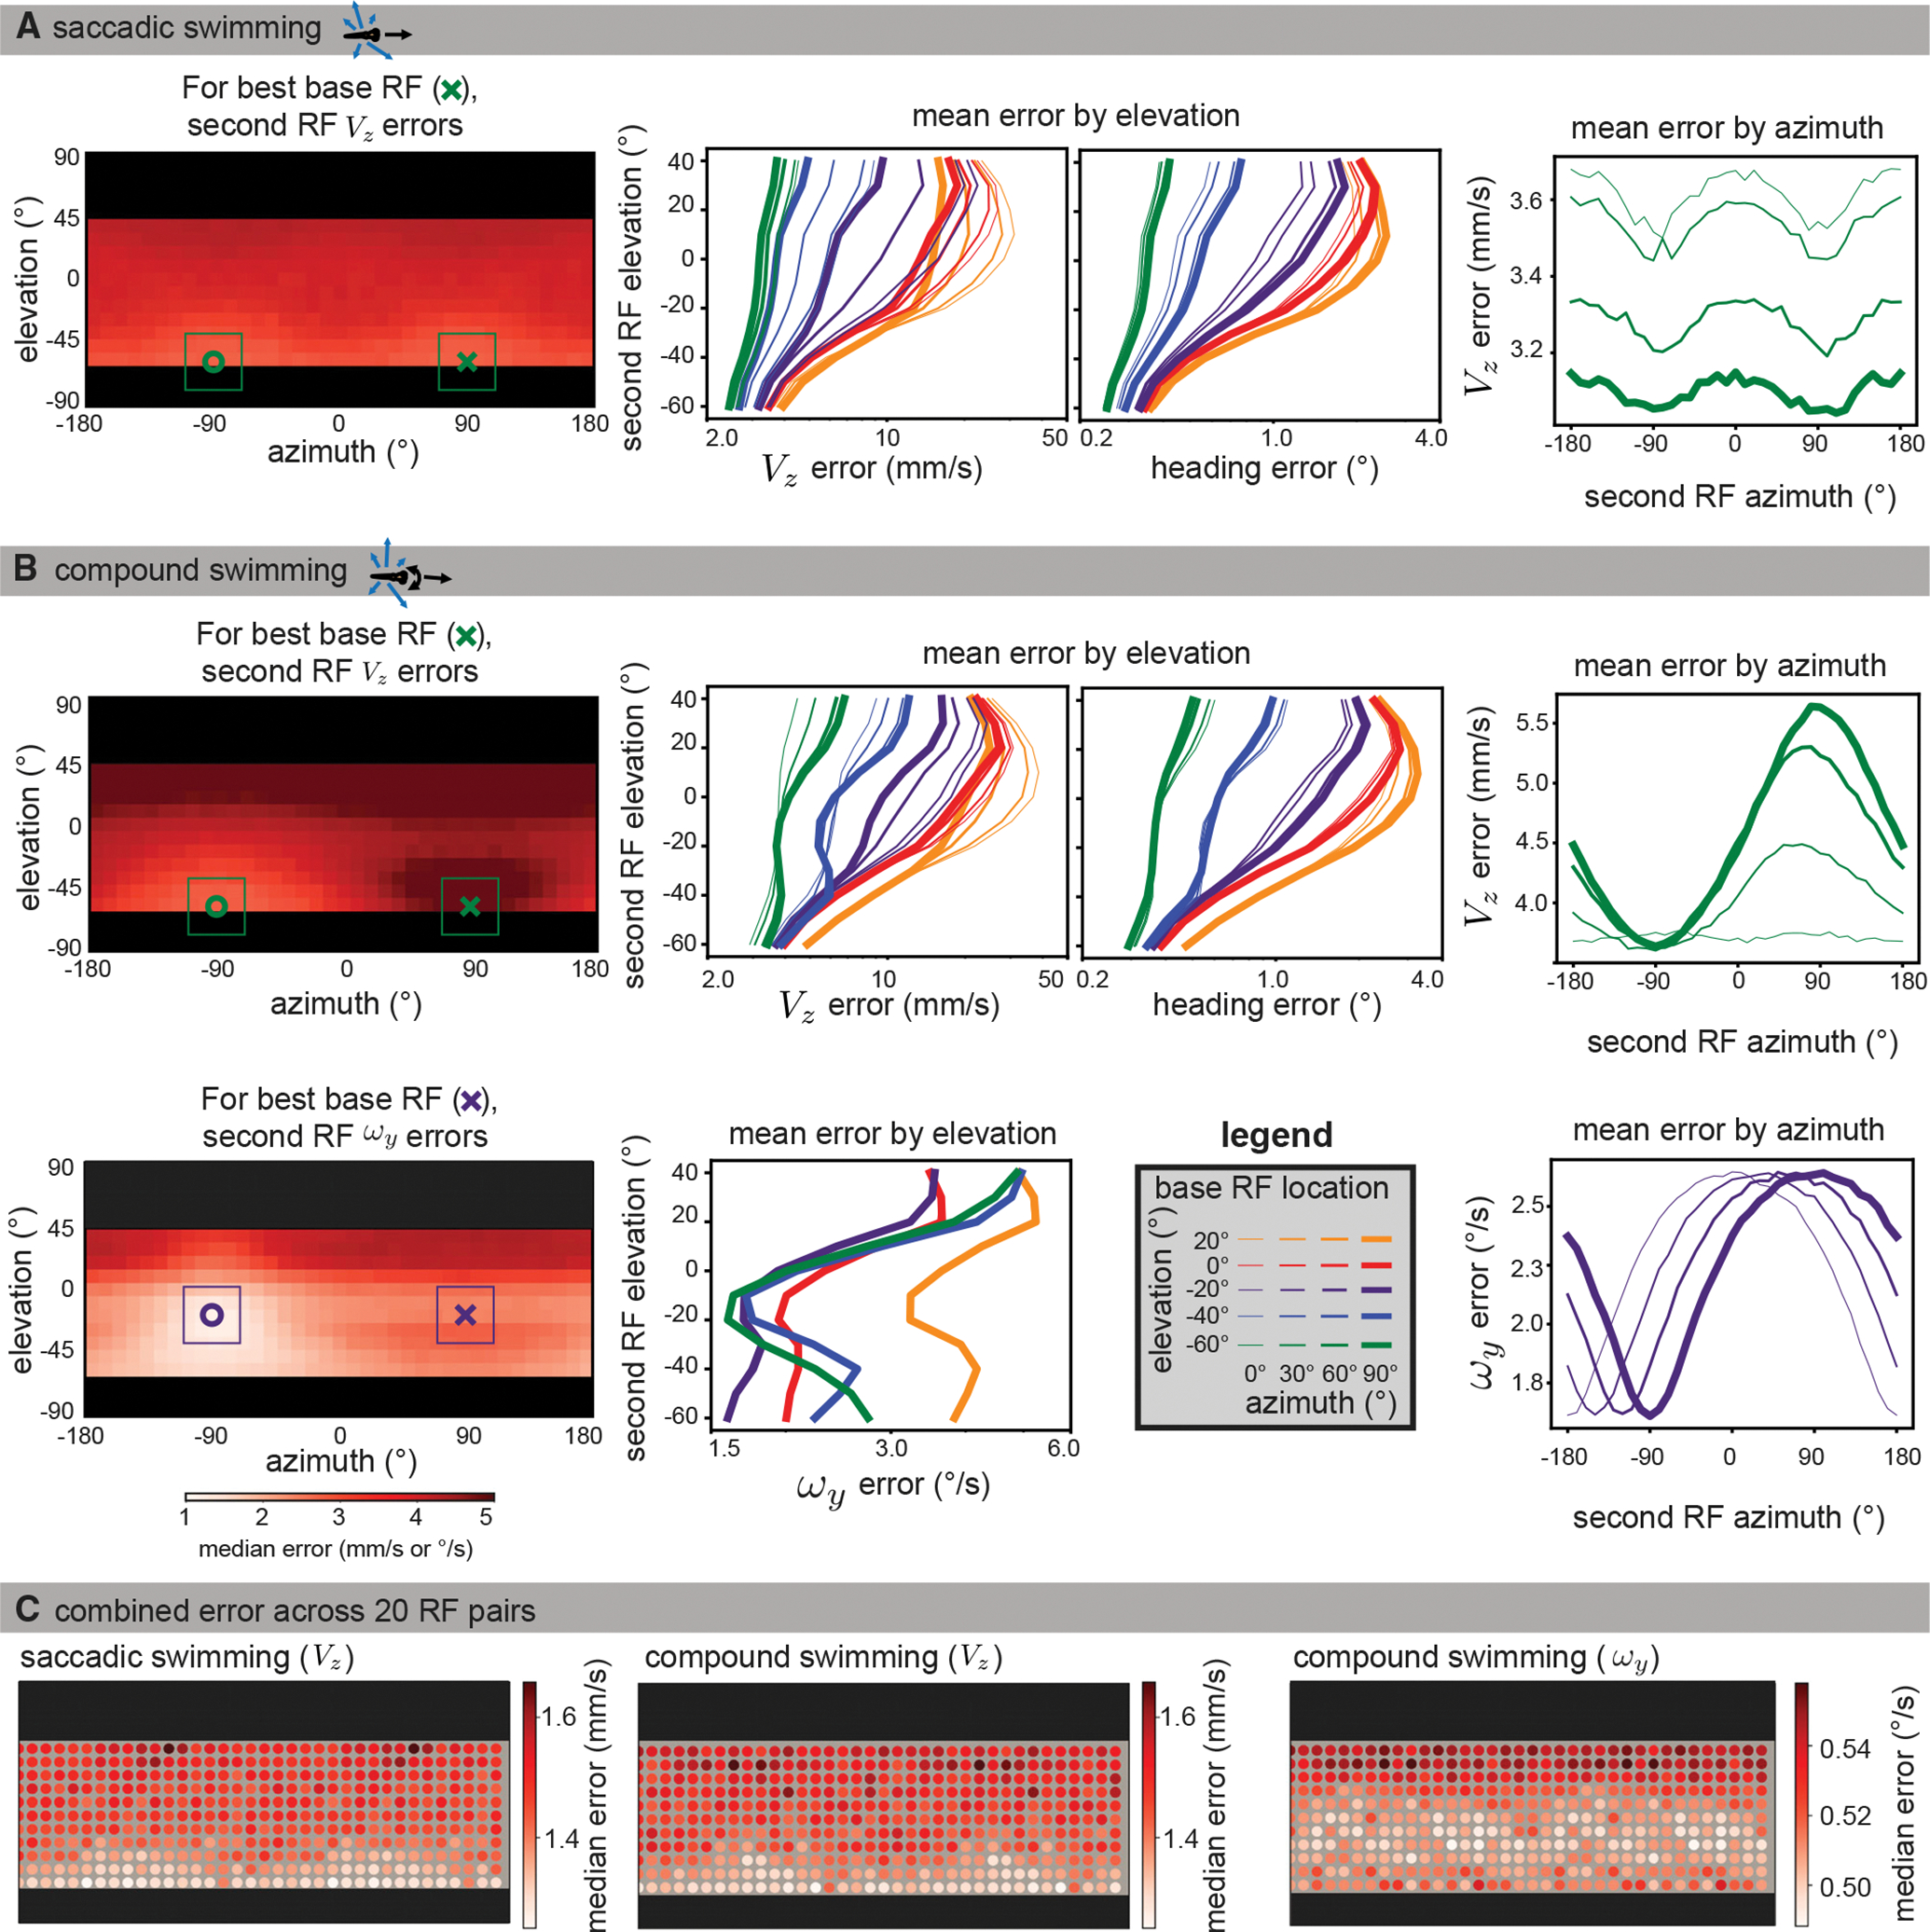
Data were simulated using naturalistic models of signal sparsity and noise, environment geometry, RF size and structure, and swimming behaviors. For each possible base RF location (see legend in B), median absolute errors were computed for 10,000 iterations across all second RF locations.
(A) Left: for saccadic swimming, the lowest error occurred when the base and second RF were located at an elevation of −60° and had azimuths of 90° and −90°, respectively. The plot shows a heatmap of the median absolute VZ error over across all second RF locations for the best base RF, and the single best base/second pair is indicated with an x and o. middle: for VZ and heading error, median absolute errors are averaged across azimuths to isolate elevation trends for each base RF location (colors indicate base RF elevation, line thicknesses indicate base RF azimuth). Both metrics show that translation is best recovered by RF pairs in the lower visual field. Right: When averaging across elevation for azimuth trends, the lower field base RFs tend to be best matched with a second RF at ±90° azimuth. For clarity, we only plot the results for the best base elevation (−60°).
(B) For compound swimming behavior, local translation errors (top left) show more extreme penalties for same-side sampling due to ambiguity with rotation. Elevation trends (top middle) are largely unaffected, other than an increase in average error, but azimuth trends (top right) show a strong advantage to sampling the lateral region on the other side of the body. The azimuth and elevation of the best individual pair are the same as for saccadic swimming. For rotation estimation (bottom), the lower field advantage is less strong, and the best performing bimodal RF (bottom left) appears at −20° elevation. Elevation trends (bottom middle) show strong performance throughout the lower field, whereas azimuth trends show no clear advantage to lateral regions, instead suggesting an azimuth separation of 180° minimizes error (bottom right). Full error maps can be seen in Figures S4 and S5, with a comparison across flow calculation methods shown in Figure S6.
(C) To characterize the performance across the visual field, we followed a similar method to the global method described in the previous section. Instead of a location sample corresponding to a single flow vector, we sampled sets of 20 RF pairs, with one centered at the sample location and the other 180° away in azimuth at the same elevation. The median absolute error over 1,000 estimates is shown for each of the motion directions from (A) and (B). Again, we see better performance in the extreme lower field for translation estimation (left, middle) and in the mid-lower field for rotation (right).
See also Figures S4–S6.