
|
Fig. 1
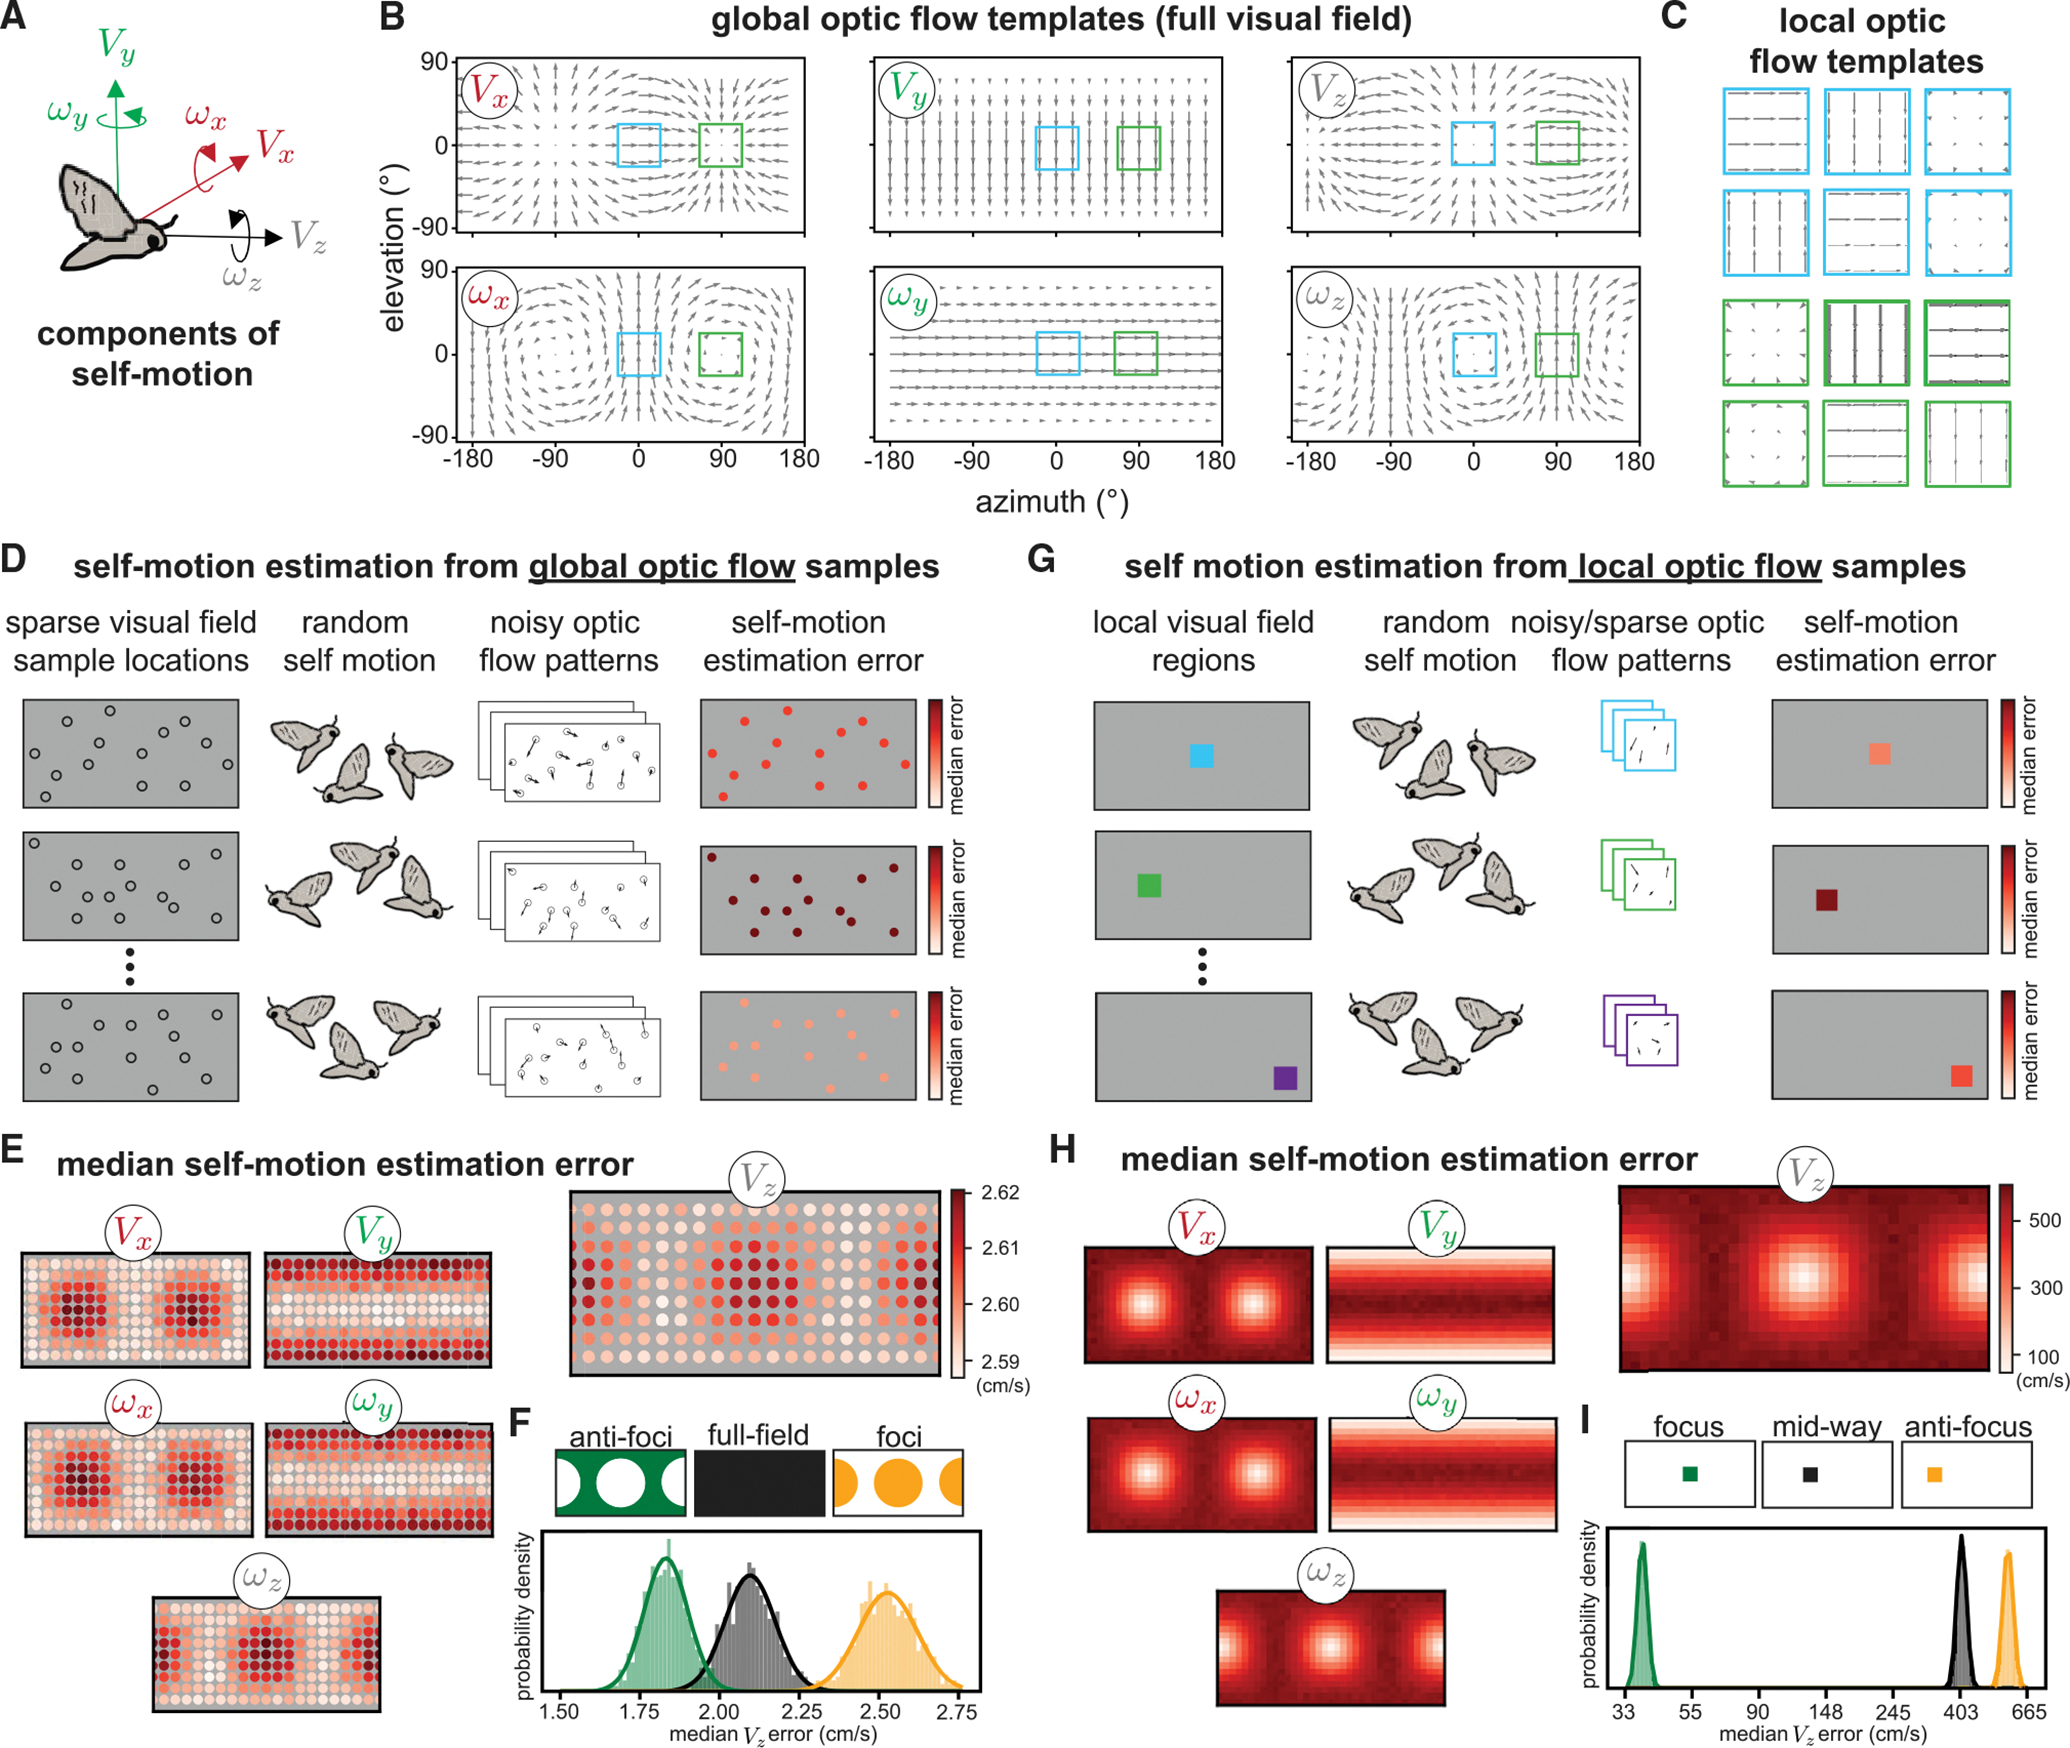
(A) We consider the optic flow generated by 6 components/directions of self-motion including translation and rotation, illustrated for a moth.
(B) Idealized optic flow templates for recovering each component of self-motion in a spherical environment are shown across the full visual field.
(C) For the blue and green regions highlighted in (B), we show the local flow templates for a 10° square region under a tangent projection. A small field of view can lead to a high degree of similarity between translation and rotation template patches (e.g., VX and ωY look very similar locally at these two positions but are more distinguishable with the full field of view). Arrowheads for the templates located at foci of expansion/contraction have been scaled up for visibility.
(D) To model self-motion estimation from sparse, noisy optic flow across the full visual field, we randomly sampled 60 visual field locations (of 180 predetermined possible locations) and calculated the median absolute self-motion estimation error for each component. Once a sample set was chosen, self-motion components were drawn uniformly at random from −1 to 1 (m/s for translation and rad/s for rotation), and additive Gaussian noise of standard deviation of 0.25 (relative to a maximal per-component flow magnitude of 1) was applied to the resulting flow vectors. The environment was modeled as a 1-m radius sphere. Each row illustrates one iteration of the model: we ran 10,000 iterations with different sample locations each time, and each iteration included 10,000 random self-motions for computing the median absolute error. Color bars indicate the median self-motion estimation error associated with each sample set. We then computed the overall median absolute error (median of medians) associated with each visual field sample location across all iterations.
(E) Heatmaps show the overall median absolute errors associated with each sample location for each self-motion component, with VZ plotted larger for visibility. The heatmap ranges for the other components are: VX (2.59,2.61), VY (2.94,2.99), ωX (1.48,1.50), ωY (1.68,1.71), and ωZ (1.48,1.50).
(F) Histograms illustrate the median VZ estimation error when 50% of the sample locations were used. These 50% could be spread evenly across the visual field (black), concentrated away from the VZ foci of expansion/contraction (green) or concentrated at these foci (orange). The anti-focus spatial bias leads to better estimates. We fitted each distribution with a Gaussian and computed the effect size (the difference between the means normalized by the pooled standard deviations) between the full field and biased samples as follows: anti-foci versus full field = −3.6; foci versus full field = 5.0.
(G) To model self-motion estimation from sparse, noisy optic flow using contiguous local visual field regions similar to receptive fields, we repeated this analysis on small, spatially contiguous regions. Each contiguous region subtended a 10° square and contained up to 100 contiguous optic flow samples, each of which had a 67% chance of being deleted after noise was added, with self-motion and additive noise sampled as before.
(H) Heat maps of the resulting median absolute errors. The heatmap ranges for the non-VZ translation components are the same as the VZ plot, and for the rotation components, they range from 20 to 350 deg/s.
(I) Histograms illustrate the median VZ estimation error (log-spaced) for the best local region (located at the VZ focus), the worst local region (located at the antifocus), and a region mid-way between those two. Effect sizes are as follows: focus versus mid-way = −64.8; anti-focus versus mid-way = 9.2.