
|
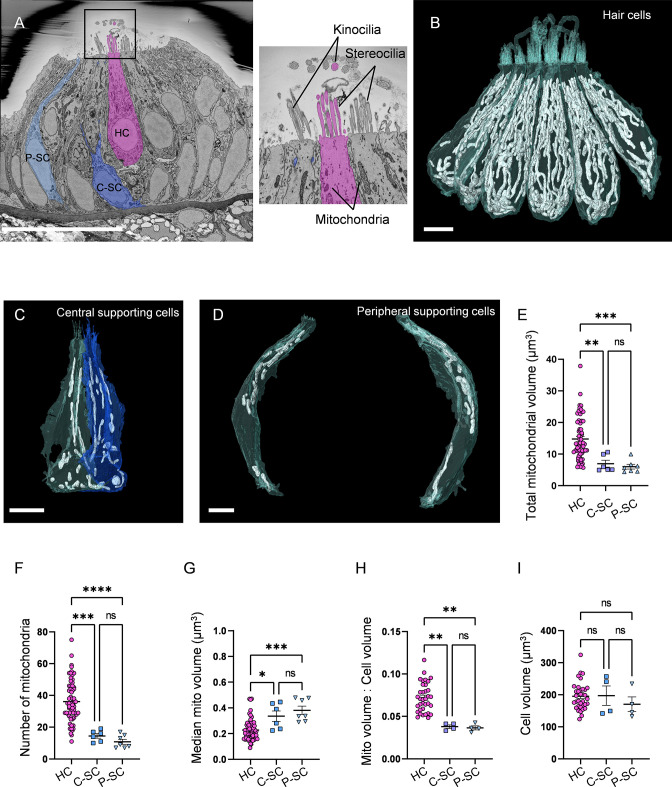
Figure 1
(A) SEM cross-section through 5 days post fertilization (dpf) zebrafish neuromasts (NM) (NM3, Figure 1—source data 2). Scale bar = 20 µm. Inset shows the stereocilia bundle and kinocilium labeled for 1 HC. (B) Six reconstructed HCs from NM3, with mitochondria shown in white. Scale bar = 5 µm. (C) Two central supporting cells (C-SCs) reconstructed from NM3. Scale bar = 5 µm. (D) Two peripheral supporting cells (P-SCs) reconstructed from NM3. Scale bar = 3.5 µm. (E) Sum of mitochondrial volume for HCs, C-SCs, and P-SCs. (In µm3) HC: 14.8 ± 0.8; C-SC; 6.9 ± 1.1, P-SC; 6.0 ± 0.7. (F) Number of individual mitochondria in HCs, C-SCs, and P-SCs. HC: 36.1 ± 1.6; C-SC: 14.5 ± 1.4; P-SC: 10.9 ± 1.5. (G) The median mitochondrial volume in HCs, C-SCs, and P-SCs. HC: 0.2 ± 0.01; C-SC: 0.3 ± 0.04; P-SC: 0.4 ± 0.03. (H) The ratio of the total mitochondrial volume to the total cell volume in HCs, C-SCs, and P-SCs. HC: 0.07 ± 0.003; C-SC: 0.04 ± 0.002; P-SC: 0.04 ± 0.002. (I) The cell volume of HCs, C-SCs, and P-SCs. HC: 195.6 ± 7.2; C-SC: 197.4 ± 30.05; P-SC: 170.4 ± 22.7. Kruskal–Wallis test with Dunn’s multiple comparisons, *p<0.05, **p<0.01, ***p<0.001, ****p<0.0001. For (E–G), HC: n = 65, 5 NMs, 3 fish; C-SC: n = 6, 3 NMs, 2 fish; P-SC: n = 7, 3 NMs, 2 fish. For (H, I), HCs: n = 35, 3 NMs, 3 fish; C-SC: n = 4, 2 NMs, 2 fish; P-SC: n = 4, 2 NMs, 2 fish. Data are presented as the mean ± SEM.
Hair cells (HCs) contain a higher mitochondrial volume than supporting cells.