
|
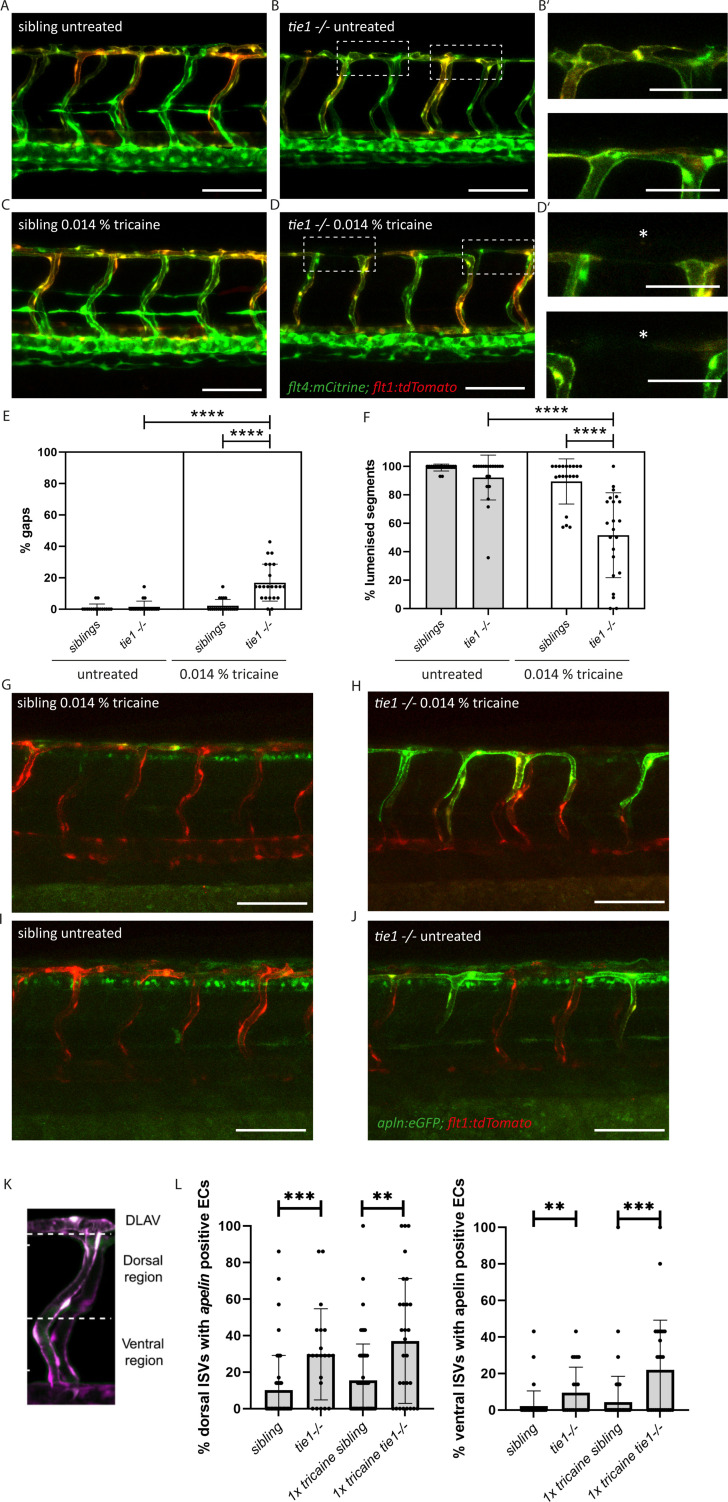
Figure 5
(A, B) Confocal images of sibling and tie1 mutant embryos at 2 dpf in a flt4:mCitrine and flt1:tdTomato transgenic background. (B’) Magnification and reduced stack of boxed area in (B). (C, D) Confocal images of sibling and tie1 mutant embryos treated with 0.014% tricaine from 30 until 48 hpf. Asterisks indicate incompletely formed DLAV segments. (D’) Magnification and reduced stack numbers of boxed area in (D). (E) Quantification of gaps in the DLAV in sibling and tie1 mutants that were either untreated or treated with 0.014% tricaine revealed significant increase of gaps in the DLAV in tie1 mutants. (F) Quantification of lumenized trunk segments of the DLAV in siblings and tie1 mutants, either untreated or treated with 0.014% tricaine (siblings untreated: n = 16; tie1−/− untreated: n = 20; siblings treated with 0.014% tricaine: n = 20; tie1−/− treated with 0.014% tricaine: n = 22), revealed significant decrease of lumenized segment numbers in the DLAV in tie1 mutants. Mann–Whitney test was applied for statistical analysis. (G, H) apelin:eGFP and flt1:tdTomato expression in 48-hpf-old embryos after tricaine treatment from 30 to 48 hpf and (I, J) in untreated conditions. (K) Maximum intensity projection of an aISV at 48 hpf, highlighting the ventral and dorsal region used for further quantifications in (J) adapted from Figure 5J of Coxam et al., 2022. (L) Quantification of ISVs with apelin expression in dorsal and ventral parts of the ISVs. Dorsal part was counted from DLAV until midline region. Lateral region was counted from midline region onwards in ventral direction. tie1 mutants showed significant increase of apelin positive ECs compared to siblings in untreated (dorsal: ***p = 0.0001; ventral: **p = 0.0028) and treated with 0.014% tricaine conditions (dorsal: **p = 0.0033; ventral: ***p = 0.0002) (siblings untreated: n = 53; tie1−/− untreated: n = 21; siblings treated with 0.014% tricaine: n = 66; tie1−/− treated with 0.014% tricaine: n = 28). Mann–Whitney test was applied for statistical analysis. Values are presented as means ± standard deviation (SD). ****p < 0.0001. Scale bar = 100 µm. hpf, hours post-fertilization; ISV, intersegmental vessel; DLAV, dorsal longitudinal anastomotic vessel; dpf, days post-fertilization.
Reduced blood flow leads to vascular anastomosis defects in tie1 mutants, similar to the defects in svep1 mutants.