
|
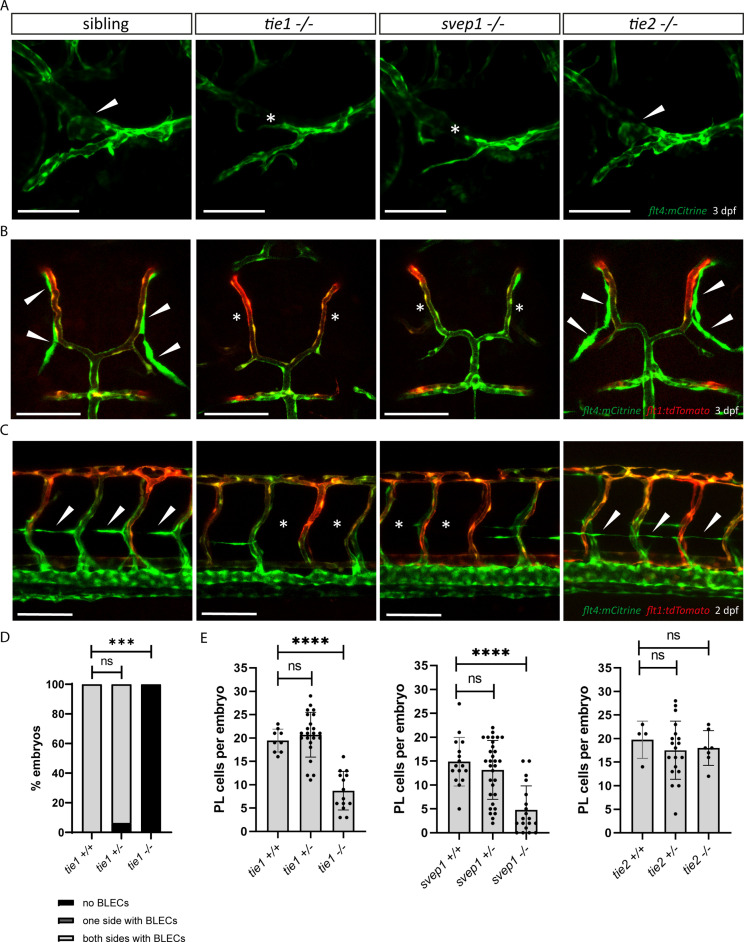
Figure 3
(A) Facial lymphatics at 3 dpf in flt4:mCitrine positive tie1, svep1 and tie2 mutants and sibling embryos (lateral view). Arrowheads point to FCLV and asterisks indicate the absence of FCLV. Scale bar = 100 µm. (B) flt4:mCitrine; flt1:tdTomato positive dorsal head vasculature in tie1, svep1, and tie2 mutants and in siblings at 3 dpf (dorsal view). In svep1 and tie1 mutants (but not in tie2 mutants) the presence of BLECs is strongly reduced. Arrowheads point to BLECs and asterisks indicate areas lacking BLECs. Scale bar = 100 µm. (C) Confocal images of PL cells, indicated by arrowheads, at 2 dpf in flt4:mCitrine; flt1:tdTomato positive tie1, svep1, and tie2 mutants and siblings, showing reduced PL numbers in svep1 and tie1 mutants. Asterisks indicate missing PLs. Scale bar = 100 µm. (D) Quantification of the presence of BLECs in tie1 mutants compared to siblings. (tie1+/+: n = 6; tie1+/−: n = 16; tie1−/−: n = 10) Mann–Whitney test was applied for statistical analysis. ***p = 0.001, ns = not significant. (E) Quantification of PL cell numbers in tie1 (tie1+/+: n = 9; tie1+/−: n = 23; tie1−/−: n = 14), svep1 (svep1+/+: n = 16; svep1+/−: n = 31; svep1−/−: n = 19), and tie2 (tie2+/+: n = 17; tie2+/−: n = 27; tie2−/−: n = 16) mutants compared to siblings. Mann–Whitney test was applied for statistical analysis. Values are presented as means ± standard deviation (SD), ****p < 0.0001, ns = not significant; BLEC, brain lymphatic endothelial cell; dpf, days post-fertilization; FCLV, facial collecting lymphatic vessel; PL, parachordal lymphangioblast.
tie1 mutants phenocopy the loss of svep1, while tie2 is dispensable for lymphangiogenesis.