
|
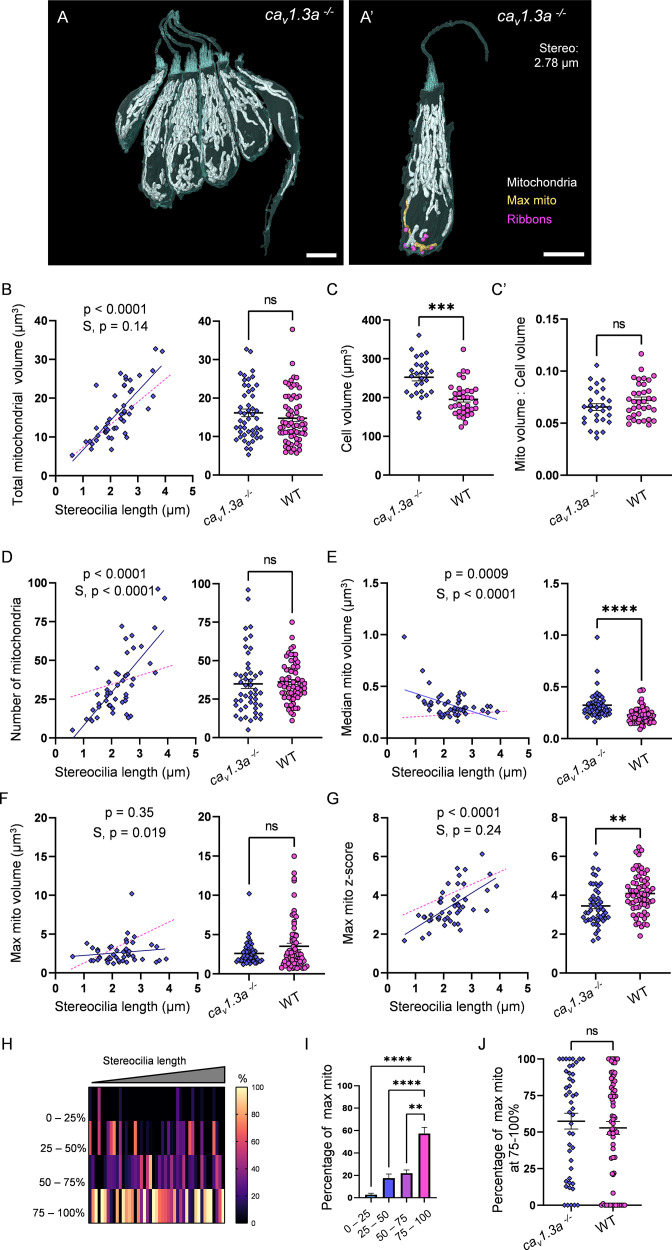
Figure 7
(A) Six representative cav1.3a hair cells (HCs) with mitochondria labeled in white (from NM13, Figure 7—source data 2). Scale bar = 5 µm. (A’) Representative mature cav1.3a HC (NM14, Figure 7—source data 2), max mito shown in gold, synaptic ribbons shown in purple. Scale bar = 5 µm. (B) Comparison of total mitochondrial volume development (left) and average (right) between cav1.3a and WT HCs. On average (in µm3): cav1.3a: 16.2 ± 1.0; WT: 14.8 ± 0.8. Kolmogorov–Smirnov test, p=0.76. (C) Total HC volume for cav1.3a and WT HCs. (In µm3) cav1.3a: 252.5 ± 9.3; WT: 195.6 ± 7.2. Kolmogorov–Smirnov test, p=0.0003. (C’) Ratio of total mitochondrial volume to HC volume. cav1.3a: 0.07 ± 0.003; WT: 0.07 ± 0.003. Kolmogorov–Smirnov test, p=0.66. (D) Comparison of the number of HC mitochondria over development (left) and on average (right) in cav1.3a and WT HCs. On average: cav1.3a: 34.9 ± 3.0; WT: 36.1 ± 1.6. Kolmogorov–Smirnov test, p=0.13. (E) Comparison of the median mitochondrial volume over development (left) and on average (right). On average (in µm3): cav1.3a: 0.3 ± 0.02; WT: 0.2 ± 0.01. Kolmogorov–Smirnov test, p<0.0001. (F) Comparison of the max mito volume over development (left) and on average (right). On average (in µm3): cav1.3a: 2.6 ± 0.2; WT: 3.5 ± 0.4. Kolmogorov–Smirnov test, p=0.14. (G) Comparison of the max mito z-score in cav1.3a and WT HCs over development (left) and on average (right). On average: cav1.3a: 3.4 ± 0.1; WT: 4.1 ± 0.1. Standard unpaired t-test, p=0.001. (B–G) Solid line represents the standard linear regression for cav1.3a HCs. Dashed line represents standard regression for WT HCs dataset as in Figure 2. Significance of the cav1.3a regression and differences in the slope from the WT regression (S) are indicated. (H) The percentage of the max mito located within each quadrant of cav1.3a HCs represented as a heat map. Three HCs in the cav1.3a dataset lacked ribbons to provide a consistent HC lowest point and were not included in this analysis. (I) Summary of the heat map data shown in (H). Most apical quadrant (0–25%): 2.8 ± 1.2%; 25–50%: 17.6 ± 3.6%; 50–75%: 22.1 ± 2.8%; Most basal quadrant (75–100%): 57.5 ± 5.4%. Kruskal–Wallis test with Dunn’s multiple comparisons, **p<0.01, ****p<0.0001. (J) Percentage of max mito located within the most basal quadrant for individual HCs. cav1.3a: 57.4 ± 5.4%, WT: 52.8 ± 4.4%. Kolmogorov–Smirnov test, p=0.77. (B, D–G) cav1.3a data: n = 48 HCs, 4 NMs, 2 fish. WT dpf data: n = 65 HCs, 5 NMs, 3 fish. (C, C’) cav1.3a data n = 28 HCs, 3 NMs, 2 fish. WT data: n = 35 HCs, 3 NMs, 3 fish. (H - J) cav1.3a data: n = 45 HCs, 4 NMs, 2 fish. WT data: n = 65 HCs, 5 NMs, 3 fish. Where applicable, data are presented as the mean ± SEM.
Synaptic transmission is necessary for gradual max mito growth.