
|
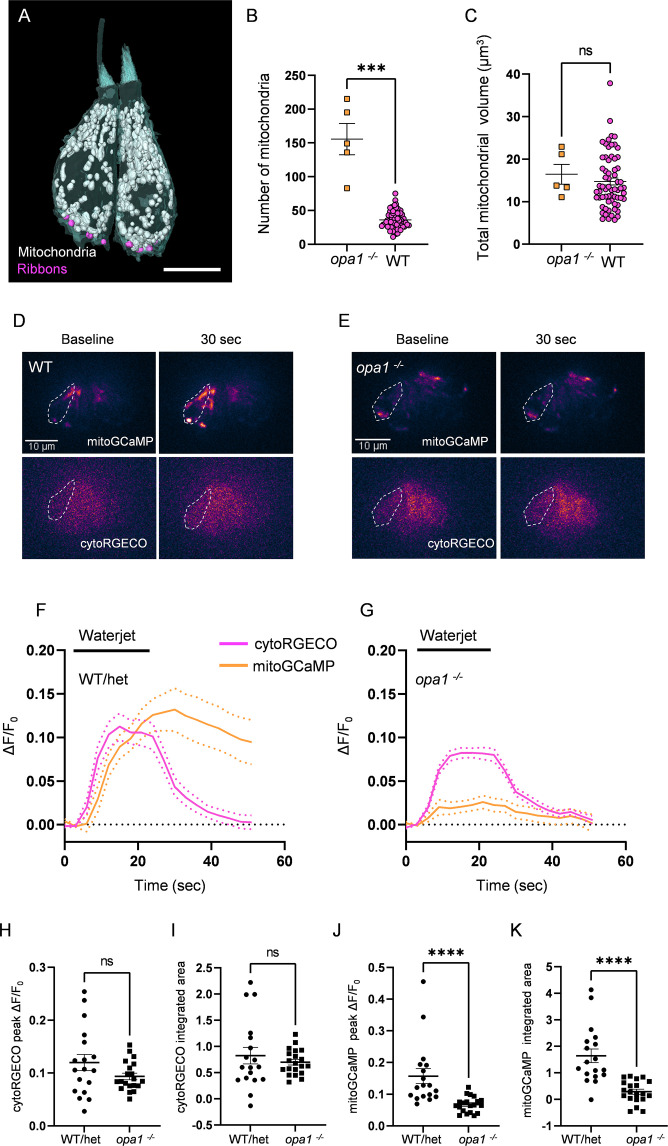
Figure 5
(A) Two representative opa1 HCs (Figure 5—source data 2). Scale bar = 5 µm. (B) Number of individual mitochondria in WT and opa1 HCs. WT: 36.1 ± 1.6; opa1: 155.6 ± 23.22. Kolmogorov–Smirnov test, p=0.0002. (C) Total mitochondrial volume in WT and opa1 HCs. In µm3, WT: 14.8 ± 0.8; opa1: 16.5 ± 2.3. Kolmogorov–Smirnov test, p=0.66. (B, C) opa1 HCs; n = 5 HCs, 1 NM, 1 fish. (D) Representative WT images of myo6:mitoGCaMP (top) and myo6:cytoRGECO (bottom) at baseline and following a waterjet stimulus. (E) Same as in (D), but for opa1 HCs. (F, G) Changes in myo6:mitoGCaMP and myo6:cytoRGECO Ca2+ signal (expressed as ΔF/F0) following a 20 s, 10 Hz waterjet for both WT/het (F) and opa1 HCs (G). (H) Peak myo6:cytoRGECO ΔF/F0 signal. WT/het: 0.1 ± 0.02; opa1: 0.1 ± 0.01, Mann–Whitney test, p=0.28. (I) Integrated myo6:cytoRGECO ΔF/F0 signal. WT/het: 0.8 ± 0.2; opa1: 0.7 ± 0.05, Mann–Whitney test, p=0.94. (J) Peak myo6:mitoGCaMP ΔF/F0 signal. WT/het: 0.15 ± 0.02; opa1: 0.05 ± 0.007, Mann–Whitney test, p<0.0001. (K) Integrated myo6:mitoGCaMP ΔF/F0 signal. WT/het: 1.6 ± 0.3; opa1: 0.2 ± 0.1, Mann–Whitney test, p<0.0001. (D–K) WT/het: n = 18 HCs, 7 fish. opa1: n = 20 HCs, 9 fish. Data are presented as the mean ± SEM.
Mutations in opa1 disrupt hair cell (HC) mitochondrial architecture and calcium buffering.