
|
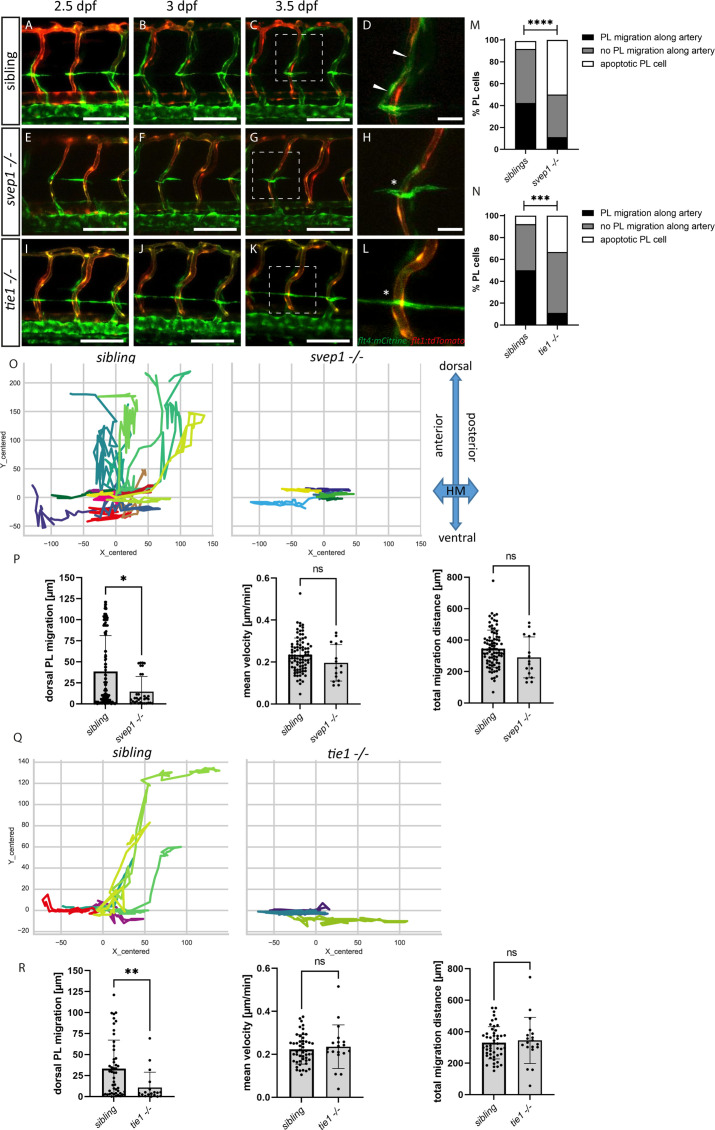
Figure 4
(A–L) Still frames from confocal time-lapse imaging of embryos in a flt4:mCitrine; flt1:tdTomato transgenic background. (A–D) PL migration (indicated by arrowheads) of sibling embryo along aISV from 2.5 to 3.5 dpf. (E–H) Failed PL migration (indicated by asterisk) of svep1 mutants and (I–L) tie1 mutants along artery from 2.5 to 3.5 dpf. (M, N) Classification of PL migration along arteries. Statistical analysis was performed using Mann–Whitney test comparing the % of PL migration along arteries in each sibling and mutant embryo (sibling: n = 96 PLs in 18 embryos; svep1−/−: n = 36 PLs in 15 embryos; siblings: n = 52 PLs in 14 embryos; tie1−/−: n = 28 PLs in 10 embryos); ****p < 0.0001, ***p = 0.0003. (O, Q) Representative cell tracking routes (tracks centred to origin) of single PL cells marked by different colours in siblings (n = 17 PLs in 4 embryos; n = 7 in 2 embryos), tie1−/− (n = 5 PLs in 2 embryos) and svep1−/− (n = 6 PLs in 3 embryos). (P, R) Quantification of dorsal and ventral PL migration (delta Y migration distance), mean velocity and total migration distance in svep1 and tie1 mutants compared to sibling embryos excluding apoptotic PLs quantified in (M, N) revealed decreased migration in dorsal and ventral direction in svep1 (*p = 0.0148) as well as tie1 mutants (**p = 0.0023). ns = not significant; aISV, arterial intersegmental vessel; dpf, days post fertilization; HM, horizontal myoseptum; PL, parachordal lymphangioblast. Scale bar = 100 µm (D, H, L = 25 µm).
PL cell migration along arteries is severely affected in svep1 and tie1 mutants.