
|
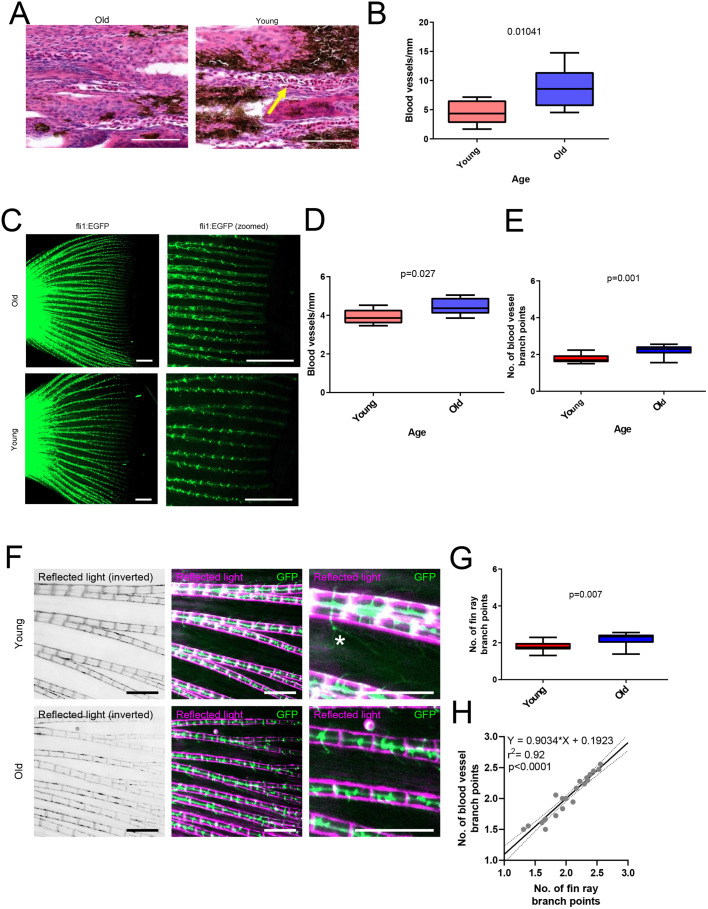
Fig. 3.
Aging increases vascular density in caudal fins. (A) Images of blood vessels in histological section of old and young turquoise killifish caudal fins stained with Hematoxylin and Eosin. An example of a blood vessel is indicated with a yellow arrow. Scale bar: 100 µm. (B) Quantification of blood vessel density in turquoise killifish sections. Statistical analysis with Mann–Whitney U-test, n=8 per group. (C) Fluorescence images of vasculature of transgenic zebrafish [roy, mitfa, Tg(fli1:EGFP)] caudal fins. Old fish were 36 months (n=8) and young fish 16 months (n=10). Scale bar: 1 mm. (D) Quantification of blood vessel density in transgenic zebrafish caudal fins. Statistical analysis with Mann–Whitney U-test. (E) Quantification of major blood vessel branch points in transgenic zebrafish caudal fins. (F) Fluorescence and reflected white light illumination images of transgenic zebrafish caudal fins. Scale bar: 0.5 mm. (G) Quantification of branching of fin rays. (H) Correlation analysis of fin ray and vascular branches. Statistical analysis using linear regression, both old and young samples combined, n=18.