
|
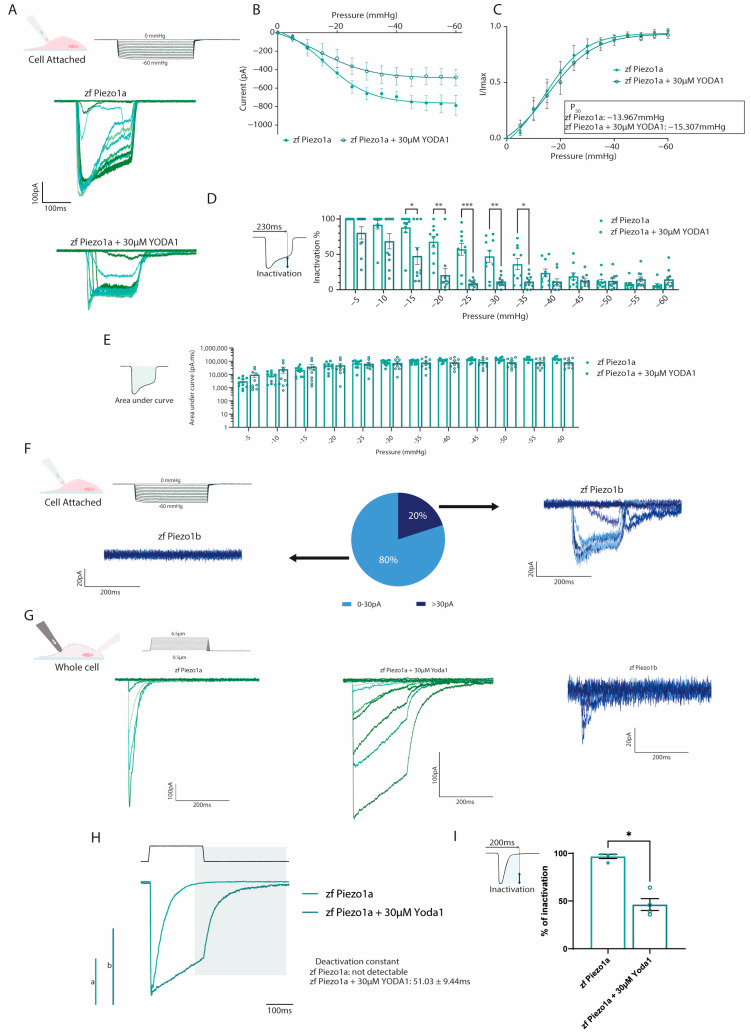
Figure 2
Electrophysiological recordings of zebrafish Piezos. (A–D) Cell-attached recordings obtained from HEK293T transfected with pIRES2-EGFP-piezo1a. n = 10 for each condition. (A) Representative zfPiezo1a traces obtained in untreated cells or cells treated with 30 µM Yoda1. (B) Current–pressure relationship. (C) I/Imax normalization fitted with Boltzmann equation. The average P50 was calculated from the fitting curve of each condition. (D) Proportion of inactivated channels 230 milliseconds after the beginning of a sweep (still under mechanical stimulation). (E) Area under curve calculated for cell-attached recordings. (F) Heterogeneity of the currents recorded in the cell-attached configuration in zf Piezo1b-transfected cells. (G) Representative whole-cell recordings obtained in cells transfected with either pIRES2-EGFP-piezo1a untreated (zf Piezo1a) or treated with 30 µM of Yoda1 (zf Piezo1a + 30 µM Yoda1) or pIRES2-EGFP-piezo1b (zf Piezo1b) and stimulated using mechanical indentations. (H) Representative deactivation current observed in the zf Piezo1a transfected cells treated with 30 µM of Yoda1. a,b: scale bars of zf Piezo1a (a) and zf Piezo1a + 30 µM Yoda1 (b), 1000 pA. (I) Proportion of current inactivated 200 milliseconds after the beginning of a sweep (still under mechanical stimulation). Data are presented as mean ± SEM. Statistical significance was assessed using two-way ANOVA followed by a Dunnett post hoc test for cell-attached recordings (B–E) and by t-test for the inactivation percentage of whole-cell recordings (I). *: p-value < 0.05, **: p-value < 0.01, ***: p-value < 0.001.