
Image
|
Figure Caption
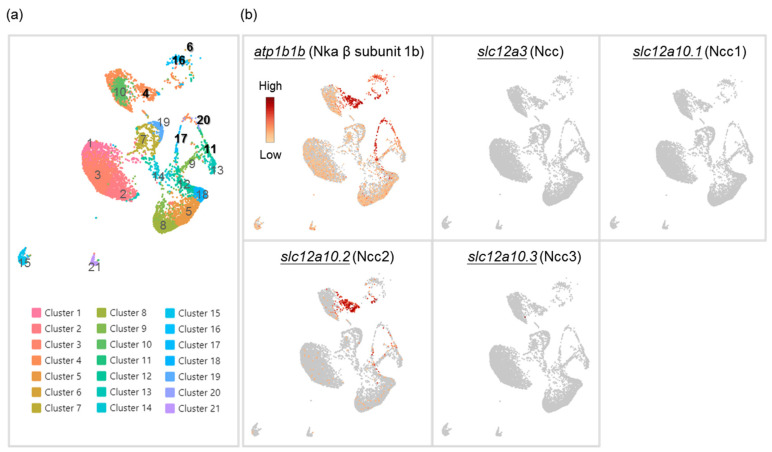
Figure 1
Cell clustering of gill cells by single-cell RNA sequencing (scRNA-Seq) analysis in adult zebrafish. scRNA-Seq shows 21 cell clusters in the gill on the UMAP (a). The distribution and expression of atp1b1b (Nka β subunit 1b), slc12a3 (Ncc), slc12a10.1 (Ncc1), slc12a10.2 (Ncc2), and slc12a10.3 (Ncc3) are shown on UMAP in the zebrafish gill cells (b).
Acknowledgments
This image is the copyrighted work of the attributed author or publisher, and
ZFIN has permission only to display this image to its users.
Additional permissions should be obtained from the applicable author or publisher of the image.
Full text @ Int. J. Mol. Sci.