
|
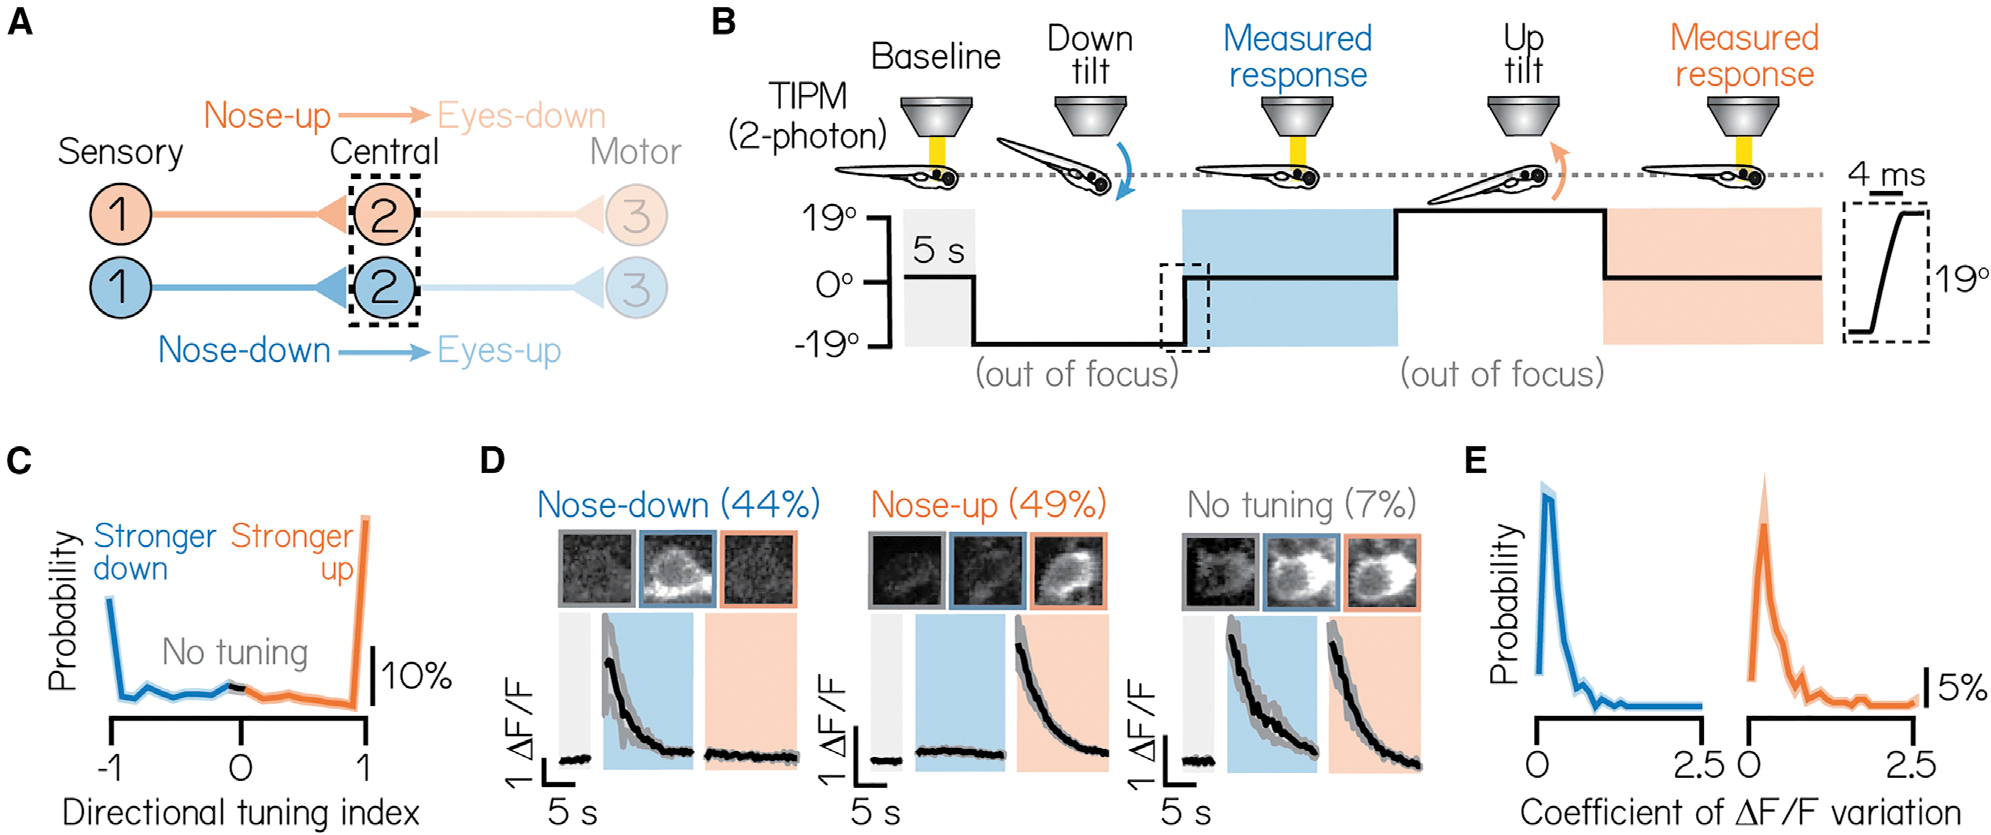
Figure 2.
(A) Circuit schematic for pitch-tilt rotation experiments. Black dashed lines outline projection neurons as circuit population of focus.
(B) Schematic of pitch-tilt rotation stimulus and imaging using Tilt In Place Microscopy (TIPM) and a two-photon microscope. Shaded regions show time of measured responses following nose-down or nose-down tilts. Inset shows a feedback trace from the galvonometer during the restoration step to horizontal.
(C) Distribution of the directional tuning for all sampled neurons. Gray region indicates neurons with no directional tuning; blue and orange regions indicate neurons with stronger nose-down or nose-up responses, respectively. Criteria are detailed in STAR Methods. Solid line shows mean from jackknife resampling; shaded bars, standard deviation.
(D) Example images and traces of a nose-down projection neuron (left), nose-up projection neuron (middle), and a projection neuron with no directional tuning (right) during TIPM. Projection neurons are visualized using the Tg(−6.7Tru.Hcrtr2:GAL4-VP16) line and express a UAS:GCaMP6s calcium indicator. Solid black lines show mean response across three stimulus repeats and shaded lines, standard deviation. Parentheses indicate the percent of neurons with each subtype, n = 467 neurons, N = 22 fish.
(E) Distributions of the coefficient of variation of peak Δ F/F responses across three stimulus repeats for nose-down (left) and nose-up (right) neurons. Solid lines show mean from jackknife resampling; shaded bars, standard deviation.
See also Figures S2 and S3.