
|
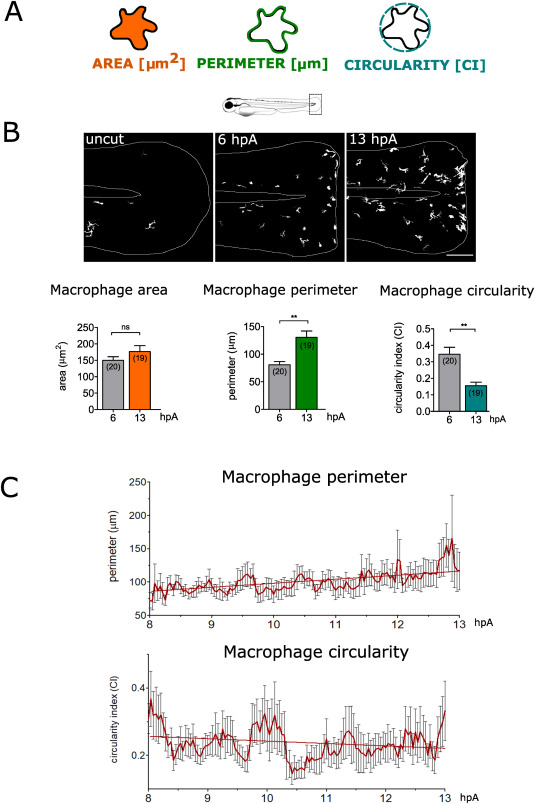
Fig. 3
Fig. 3. Macrophages change their morphology at the wound (A) Representation of 2-D morphometric descriptors used for macrophage shape analysis: area, perimeter and circularity. (B) Up: Representative images of non-amputated and amputated fin folds of Tg(mpeg1:Gal4/UAS:Kaede) larvae at 6 and 13 hpA; confocal maximum projections of keade fluorescence (white) in macrophages. White lines outline the fin fold. Down: Quantification of area, perimeter and circularity for individual macrophages at 6 and 13 hpA. Number of analysed macrophages is indicated in parenthesis. (mean±sem) Representative experiment of five independent experiments, two-tailed paired t-test, **p < 0.01, ns – not significant. (C) Quantification of perimeter (upper graph) and circularity value (lower graph) for individual macrophages present at the wound, during a time lapse sequence from 8 hpA to 13 hpA every 2.5 min (mean±sem).
Reprinted from Free radical biology & medicine, 192, Sipka, T., Park, S.A., Ozbilgic, R., Balas, L., Durand, T., Mikula, K., Lutfalla, G., Nguyen-Chi, M., Macrophages undergo a behavioural switch during wound healing in zebrafish, 200-212, Copyright (2022) with permission from Elsevier. Full text @ Free Radic. Biol. Med.