
|
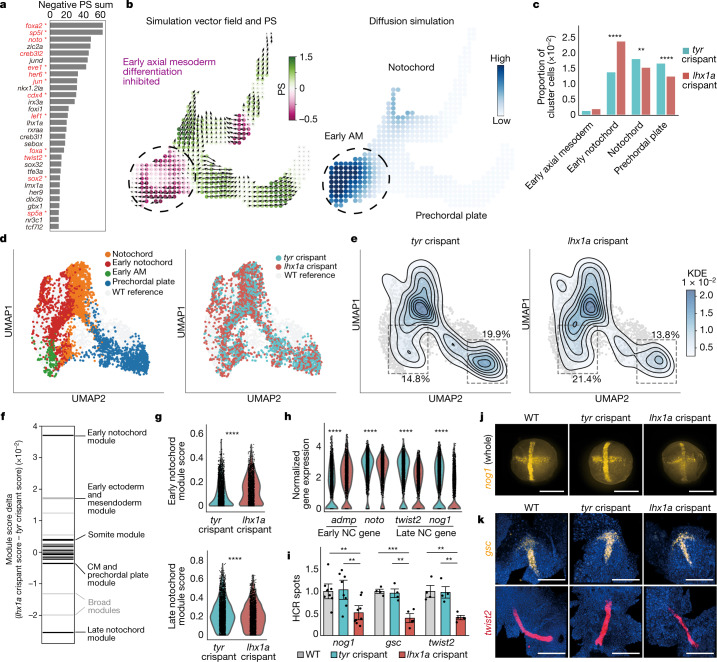
Fig. 5
a, Top 30 TFs according to predicted KO effects. Red and *: previously reported notochord regulators (Supplementary Table 2). lhx1a, sebox and irx3a were selected for experimental validation. b, lhx1a LOF simulation in the axial mesoderm sub-branch, predicting an inhibition of axial mesoderm differentiation from early stages. c, scRNA-seq validation of experimental LOF: cell cluster composition of the axial mesoderm clusters normalized to the whole cell number in lhx1a and tyr (control) crispant samples. Early notochord is significantly expanded (P = 1.34 x 10⁻³⁵, chi-square test) and differentiated axial mesoderm populations are significantly depleted (notochord: P = 3.83 x 10⁻³; prechordal plate: P = 1.28 x 10⁻⁷, chi-square test) in lhx1a crispants. d, lhx1a and tyr crispant axial mesoderm cells at 10 hpf. Left, cell type annotation of lhx1 and tyr crispant cells. Right, lhx1a and control crispant data projected onto the WT UMAP. e, Control cell density (left, n = 2,342 cells) and lhx1a crispant cell density (right, n = 2,502 cells). f, Rug plot showing the difference in averaged NMF module scores between lhx1a and tyr crispants in notochord lineage cells. Black, cell-type-specific modules. Light grey, broad cluster modules. CM, cephalic mesoderm. g, Violin plot of NMF module score in notochord lineage cells (n = 1,918 lhx1a crispant and n = 2,616 tyr crispant cells. h, Violin plots of gene expression in the notochord (NC) lineage cells. ****P < 0.0001, two-tailed Wilcoxon rank-sum test with Bonferroni correction. i, Quantification (number of spots in flattened HCR image) normalized to WT. Mean ± s.e.m. n = 2 independent biological replicates, 8 embryos per replicate. nog1: P = 0.0022 (WT versus lhx1a crispant), P = 0.0052 (tyr versus lhx1a crispant); gsc: P = 0.00042 (WT versus lhx1a crispant), P = 0.0018 (tyr versus lhx1a crispant); twist2: P = 0.0011 (WT versus lhx1a crispant), P = 0.0012 (tyr versus lhx1a crispant); two-sided t-test. j, Representative HCR images for nog1 expression (yellow) in whole embryos at 10 hpf. k, Representative flattened HCR images of 10 hpf embryos stained with probes against gsc (yellow) and twist2 (red); nuclei are stained with DAPI (blue). Scale bars, 300 μm.