
|
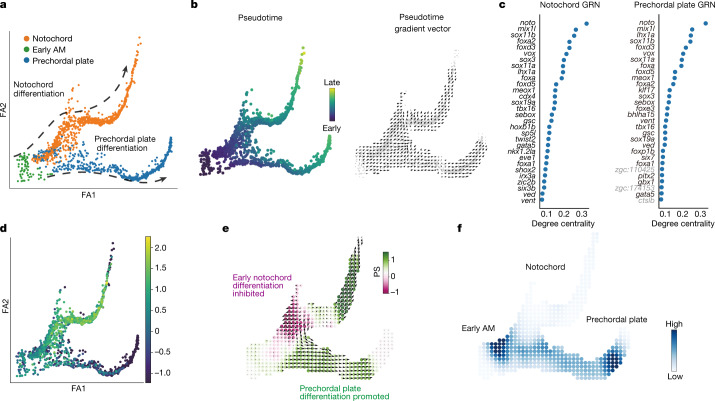
Fig. 3
a, Two-dimensional force-directed graph of the axial mesoderm (AM) sub-branch (n = 1,669 cells) in a published zebrafish embryogenesis atlas (Farrell et al.32). Arrows indicate notochord cell differentiation (top) and prechordal plate differentiation (bottom). b, Conversion of URD-calculated pseudotime (left) into a 2D pseudotime gradient vector field (right). c, Degree centrality scores were used to rank the top 30 TFs in notochord (left) and prechordal plate (right). Black text denotes TFs. Grey text denotes non-TFs. d, Expression of noto projected onto the axial mesoderm sub-branch. e, Noto KO simulation vector and perturbation scores. f, Markov simulation to estimate cell density in the noto KO sample. The simulation predicted inhibited early notochord differentiation and promotion of prechordal plate differentiation, indicating a potential lineage switch.