
|
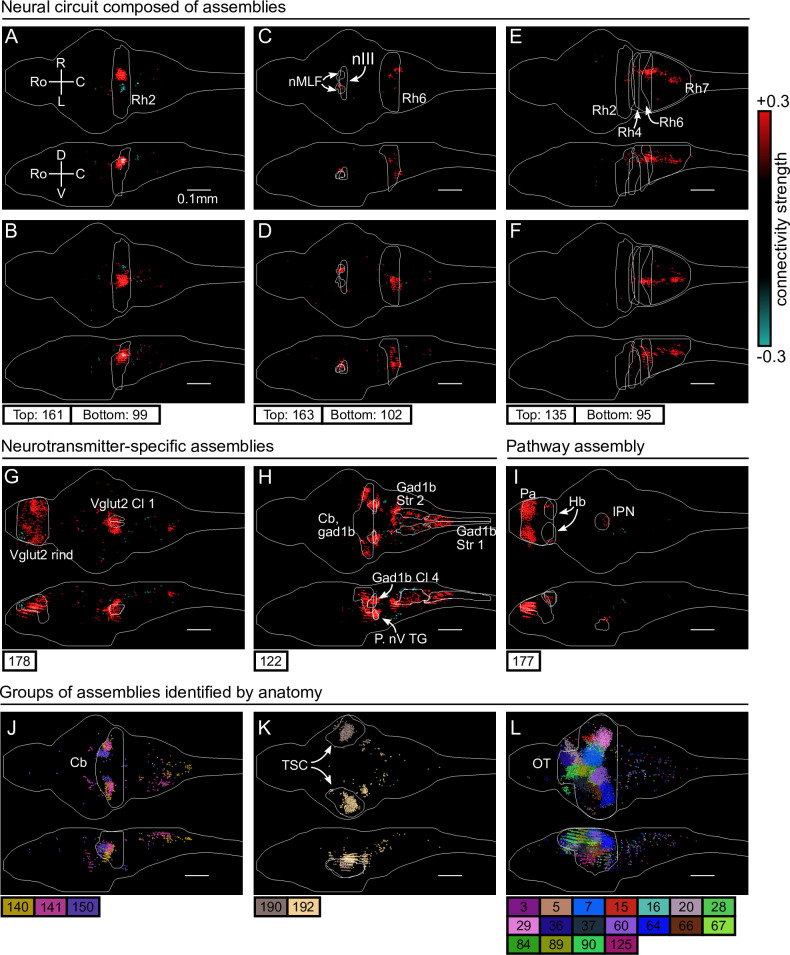
Figure 3
(A–I) Individual example assemblies μ are shown by coloring each neuron with its connectivity weight value (see color bar at the right hand side). The assembly index μ is stated at the bottom of each panel. The orientation and scale are given in panel A (Ro: rostral, C: caudal, R: right, L: left, D: dorsal, V: ventral). Anatomical regions of interest, defined by the ZBrain Atlas (Randlett et al., 2015), are shown in each panel (Rh: rhombomere, nMLF: nucleus of the medial longitudinal fascicle; nIII: oculomotor nucleus nIII, Cl: cluster; Str: stripe, P. nV TG: Posterior cluster of nV trigeminal motorneurons; Pa: pallium; Hb: habenula; IPN: interpeduncular nucleus). (J–L) Groups of example assemblies that lie in the same anatomical region are shown for cerebellum (Cb), torus semicircularis (TSC), and optic tectum (OT). Neurons i were defined to be in an assembly μ when , and colored accordingly. If neurons were in multiple assemblies shown, they were colored according to their strongest-connecting assembly.
cRBM assemblies compose functional circuits and anatomical structures.