
|
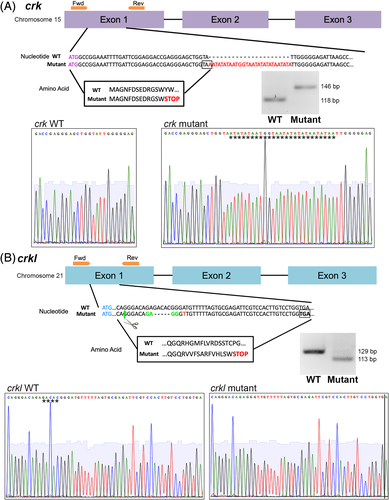
Fig. 4 crk and crkl mutant zebrafish lines generated by CRISPR/Cas9. Exon structure, nucleotide sequence, and amino acid sequence diagram of mutations generated by CRISPR/Cas9. Sanger sequencing reads of wild-type and mutant alleles, inserted (crk) or deleted (crkl) sequence denoted by stars. Agarose gel images of wild-type and mutant alleles after crk and crkl genotyping PCRs and, for crkl, the PCR product is digested with MnlI enzyme. A, crk mutant allele. Exons 1–3 of crk shown in purple, forward and reverse primers for genotyping shown in orange on exon structure diagram. crk start codon shown in purple lettering, 28 bp insertion mutation shown in red lettering in the nucleotide sequence with predicted STOP codon boxed. Resulting amino acid sequence boxed. B, crkl mutant allele. Exons 1–3 of crkl diagrammed in blue, forward and reverse primers around the mutation site shown in orange above exon 1. crkl start codon shown in blue lettering, 5 bp deletion site shown with dash marks in mutant allele, MnlI enzyme recognition and cut site for genotyping marked with green, point mutation marked with red lettering and predicted STOP codon boxed. Resulting amino acid sequence boxed