
Image
|
Figure Caption
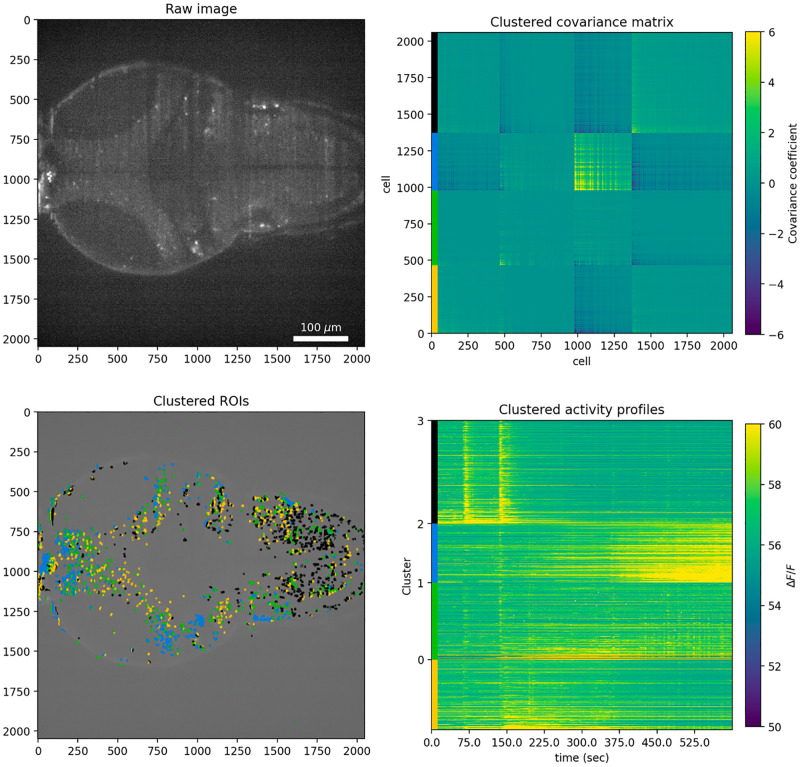
Fig 5
Analysis pipeline for Suite2P-processed data with k-means clustering for k = 4 (four clusters).
Top left: first raw image of the timeseries imaging data. Top right: k-means-clustered covariance matrix of ROIs activity. Color bars on the left correspond to different clusters. Bottom left: Spatial distribution of Suite2P neuron ROIs colored according to covariance matrix clustering. Colors indicate cluster membership according to k-means clustering of the covariance matrix. Bottom right: Activity traces for each Suite2P ROI. Color bars on the left indicate cluster membership according to k-means clustering of the covariance matrix.
Acknowledgments
This image is the copyrighted work of the attributed author or publisher, and
ZFIN has permission only to display this image to its users.
Additional permissions should be obtained from the applicable author or publisher of the image.
Full text @ PLoS One