
|
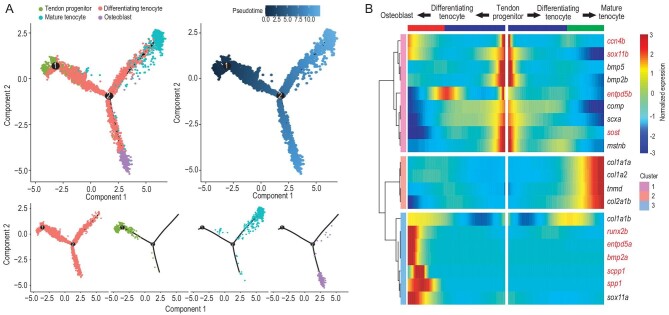
Figure 2.
Differentiation trajectory construction of tendons and intermuscular bones, and screening of key regulators for IB formation. (A) Diffusion map visualization of the tendon and IB trajectories simulated by monocle2 across tendon progenitors, mature tenocytes, differentiating tenocytes and osteoblasts on the left. The corresponding diffusion pseudo-time is indicated in the bottom-left frame. A diffusion map visualization of each cluster is shown on the right. (B) Heatmap of the gene expression (smoothed over three adjacent cells) in subsets ordered by the pseudo-time of mature tenocytes and osteoblasts, as in (A); some curated genes are shown.