
IMAGE
Fig. 6
- ID
- ZDB-IMAGE-221113-6
- Publication
- Van Dycke et al., 2021 - A Novel Class of Norovirus Inhibitors Targeting the Viral Protease with Potent Antiviral Activity In Vitro and In Vivo
- All Figures
- Figures for Van Dycke et al., 2021
Image
|
Figure Caption
Fig. 6
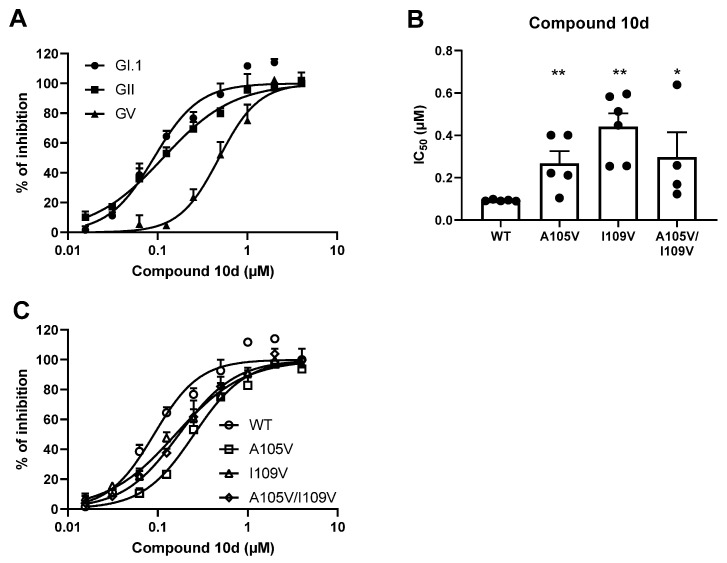
The susceptibility of mutated GI.1 proteases to compound 10d. (A) Dose–response inhibition curves showing the effect of compound 10d on the WT proteases. (B) IC50 values of compound 10d on the WT or mutant GI.1 proteases. (C) Dose–response inhibition curves showing the effect of compound 10d on the WT or mutant GI proteases. Mean values ±SEM are presented, Mann–Whitney test, ** p < 0.01, * p < 0.05.
Acknowledgments
This image is the copyrighted work of the attributed author or publisher, and
ZFIN has permission only to display this image to its users.
Additional permissions should be obtained from the applicable author or publisher of the image.
Full text @ Viruses