
Image
|
Figure Caption
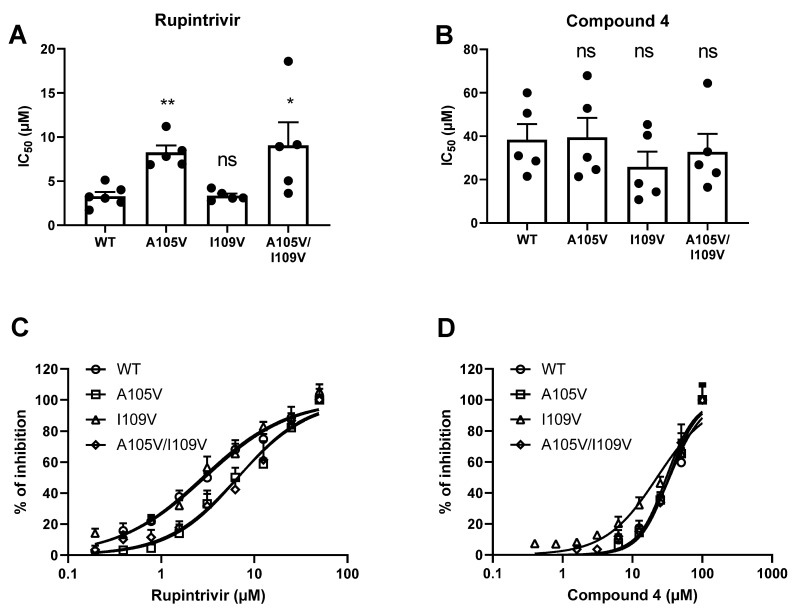
Fig. 4
The susceptibility of mutated GI.1 proteases to rupintrivir and compound 4. IC50 values of rupintrivir (A) and compound 4 (B) on the WT or mutant GI proteases. Dose–response inhibition curves of rupintrivir (C) and compound 4 (D) on the WT or mutant GI proteases. Mean values ±SEM are presented, Mann–Whitney test ** p < 0.01, * p < 0.05, ns: not significant.
Acknowledgments
This image is the copyrighted work of the attributed author or publisher, and
ZFIN has permission only to display this image to its users.
Additional permissions should be obtained from the applicable author or publisher of the image.
Full text @ Viruses