
|
Fig. 7
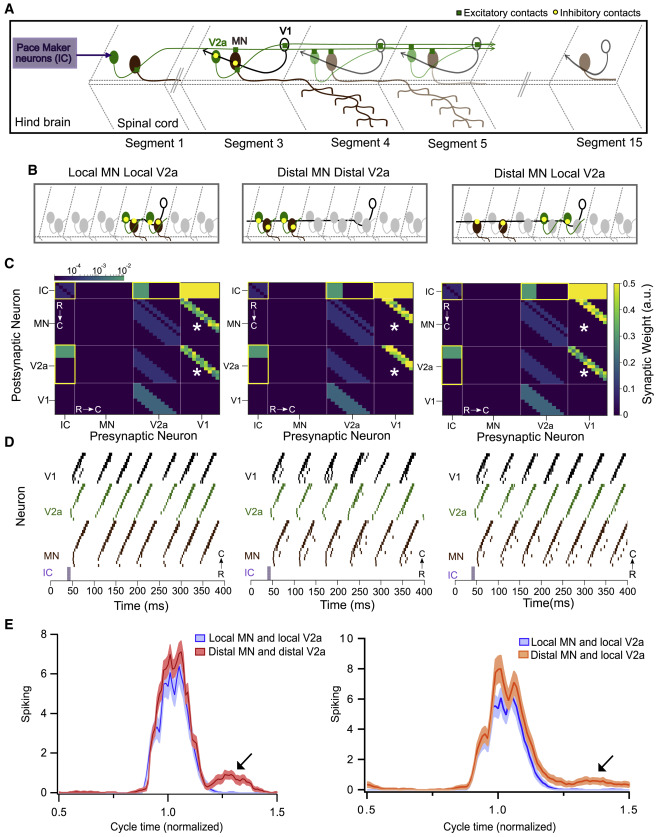
Figure 7. Modeling spinal circuitry with local and distal V1 inhibition (A) Schematic of the computational model showing a reduced V1 (black), V2a (green), and motor neuron (MN) (brown) network driven by rostrally located pacemaker neurons (purple box). (B) Schematic of 3 different network structures simulated with the network model. Left: local connectivity from V1 neurons onto MNs and V2as. V1s synapse onto V2as and MNs located within 1–3 segments. Middle: distal connectivity from V1s onto MNs and V2as. V1s synapse onto V2as and MNs located 4–6 segments away. Right: mixed local-distal connectivity from V1s. V1s synapse onto MNs located 4–6 segments away and V2as located within 1–3 segments. (C) Heatmap showing connectivity weights for neurons across 3 different network models. Connections outlined in yellow are gap junctional and follow a logarithmic scale. Asterisks indicate connection weights that are altered across models. (D) Raster plots of spike times from 1 representative simulation of each network. (E) Spiking of MNs with respect to a normalized swim cycle. Black arrow points to the extraneous spiking observed for both distal MN/distal V2a connectivity (left) and more weakly in distal MNs/local V2a connectivity (right). See also Figure S7 and Tables S1 and S2.