
|
Fig. 4
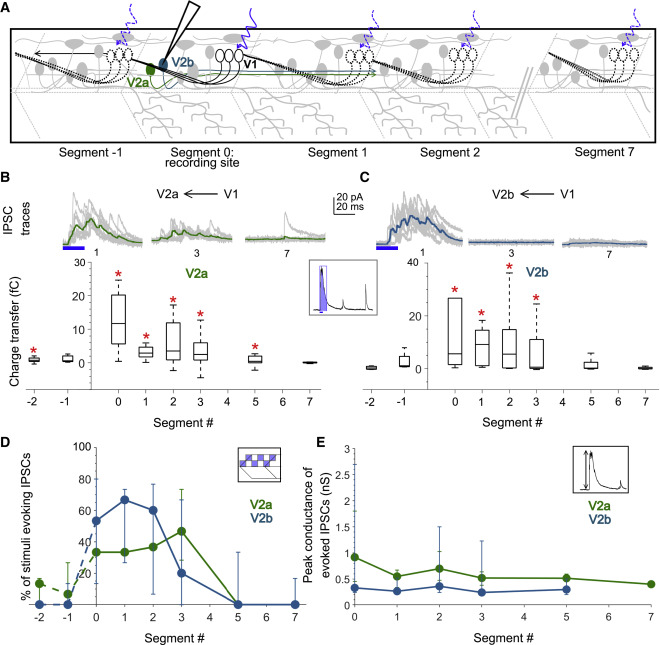
Figure 4. V1 neurons inhibit V2a and V2b neurons locally (A) Schematic of the experimental design showing intracellular recordings from V2a (green) and V2b (cyan) neurons paired with optical stimulation of V1 neurons (black) along the rostro-caudal axis. (B) Top: representative overlay of 15 traces of IPSCs recorded in V2a neurons during illumination of segments 1, 3, and 7 caudal to the recorded neuron position. Colored trace represents mean. Duration of the optical stimulus is shown as a blue bar. Bottom: boxplots show the total charge transfer per segment recorded in V2a neurons. Red asterisks mark segments that were significantly different from noise (p < 0.01). n = 8–14 neurons for each data point. (C) Same as in (B) for V2b neurons. n = 5–9 neurons. (D and E) Comparison of the percent of squares in the optical stimuli grid that evoked IPSCs (D) and the peak conductance of IPSCs (E) in V2a (green) and V2b (cyan) neurons. n = 8–14 V2as and 5–9 V2bs. See also Figure S4.