
|
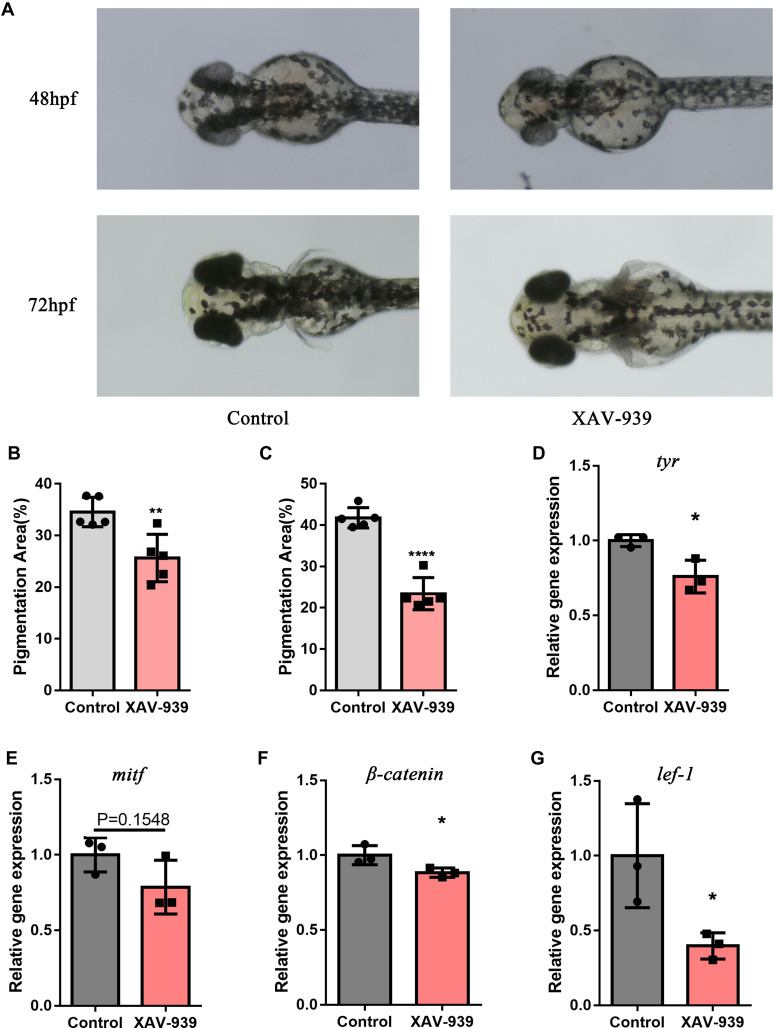
Fig. 6 Wnt/β-catenin pathway inhibitor reduced melanogenesis and gene expression of β-catenin, lef1, mitf and tyr in zebrafish. (A) Melanin granules in the heads of zebrafish at 48hpf and 72hpf. (B) Using ImageJ, the area of melanin granules as a percentage of the head area was measured at 48hpf. Each bar graph represents the Mean±SD value of one group (control, Mean±SD=34.53±1.27;XAV-939, Mean±SD=25.63±2.05). (C) The area of melanin granules as a percentage of the head area was measured at 72hpf. Each bar graph represents the Mean±SD value of one group (control, Mean±SD=41.76±1.10;XAV-939, Mean±SD=23.41±1.75). (D–G) The relative expression of four genes were confirmed with q-PCR. The fold change values of each gene were: tyr(control, Mean±SD=1.00± 0.02;XAV-939, Mean±SD=0.76±0.06), mitf(control, Mean±SD=1.00±0.07;XAV-939, Mean±SD=0.79±0.10), β-catenin(control, Mean±SD=1.00± 0.04;XAV-939, Mean±SD=0.88± 0.02) and lef1(control, Mean±SD=1.00±0.20;XAV-939, Mean±SD=0.40±0.05). Pigmentation area (%) was defined as the area of melanin granules as a percentage of area of the head of zebrafish; hpf, hour post fertilization; q-PCR, Quantitative polymerase chain reaction. (*P<0.05,**P<0.01,****P<0.0001).