
Image
|
Figure Caption
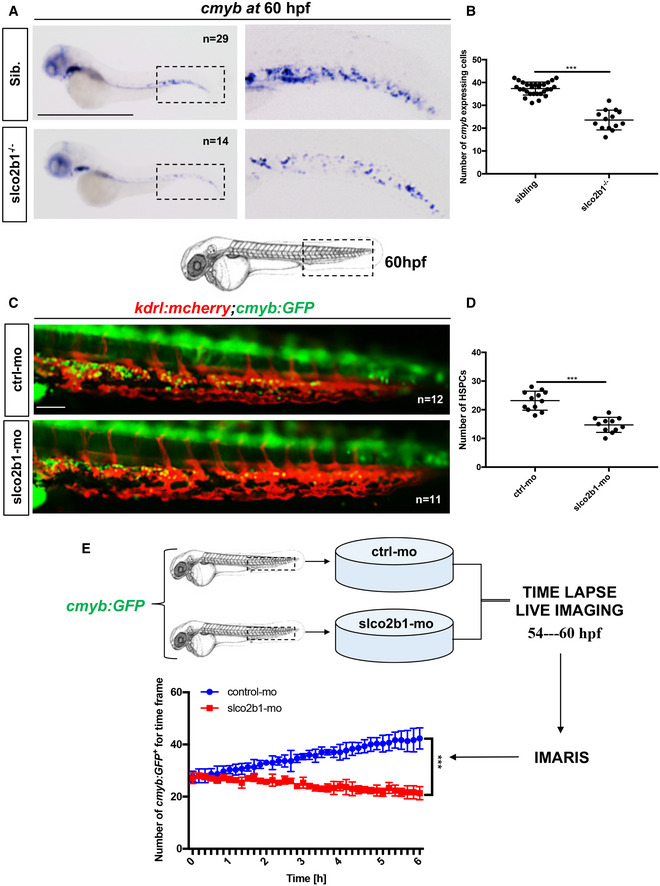
Fig. 3
The deficiency of slco2b1 induces a decrease of HSPC in the CHT
- AWISH for cmyb expression at 60 hpf in wild‐type and slco2b1 −/− embryos.
- BQuantification of cmyb‐expressing cells. Each n represents the number of cmyb‐expressing cells for each embryo (biological replicates). Each experiment has been repeated three independent times.
- CSchematic indicating the imaging area in the tail at 60 hpf, as indicated by the black box; fluorescence imaging in the CHT of kdrl:mCherry;cmyb:GFP embryos injected with control‐ and slco2b1‐Mos.
- DQuantification of HSPCs associated with ECs. Each n represents the number of yellow spots for each embryo (biological replicates). Each experiment has been repeated three independent times.
- EExperimental outline and quantification of time‐lapse live imaging in controls and slco2b1‐morphants cmyb:GFP + cells, using Imaris software.
Data information: Center values denote the mean, and error values denote s.e.m. The statistical analysis was completed using an unpaired two‐tailed t‐test. ***P < 0.001. Scale bar is 500 μm (A); 200 μm (C).
Source data are available online for this figure.
Figure Data
Acknowledgments
This image is the copyrighted work of the attributed author or publisher, and
ZFIN has permission only to display this image to its users.
Additional permissions should be obtained from the applicable author or publisher of the image.
Full text @ EMBO J.