
Image
|
Figure Caption
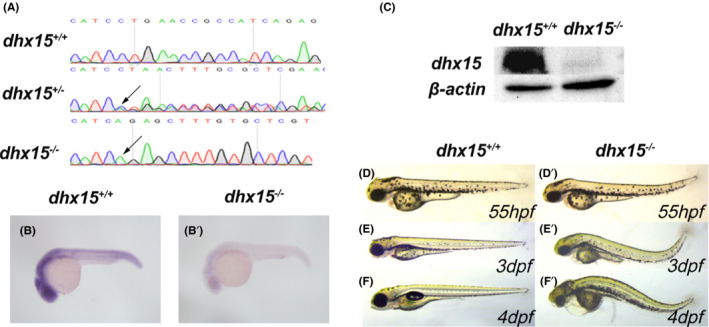
Fig. 1
Generation of dhx15−/− zebrafish. A, DNA sequencing results of dhx15+/+ , dhx15+/− , and dhx15−/− embryos. Arrows indicate a 13 bp deletion (CTGAACCGCCATC) at dhx15 exon 2. B, B’, WISH analysis of dhx15 in dhx15+/+ and dhx15−/− embryos at 24 hpf. C, Western blot analysis of dhx15 in dhx15+/+ and dhx15−/− embryos at 3 dpf. D‐F’, Bright‐field microscopy images of dhx15+/+ and dhx15−/− zebrafish. dpf, days post fertilization; hpf, hours post fertilization; WISH, whole‐mount in situ hybridization
Figure Data
Acknowledgments
This image is the copyrighted work of the attributed author or publisher, and
ZFIN has permission only to display this image to its users.
Additional permissions should be obtained from the applicable author or publisher of the image.
Full text @ Cancer Sci.