
|
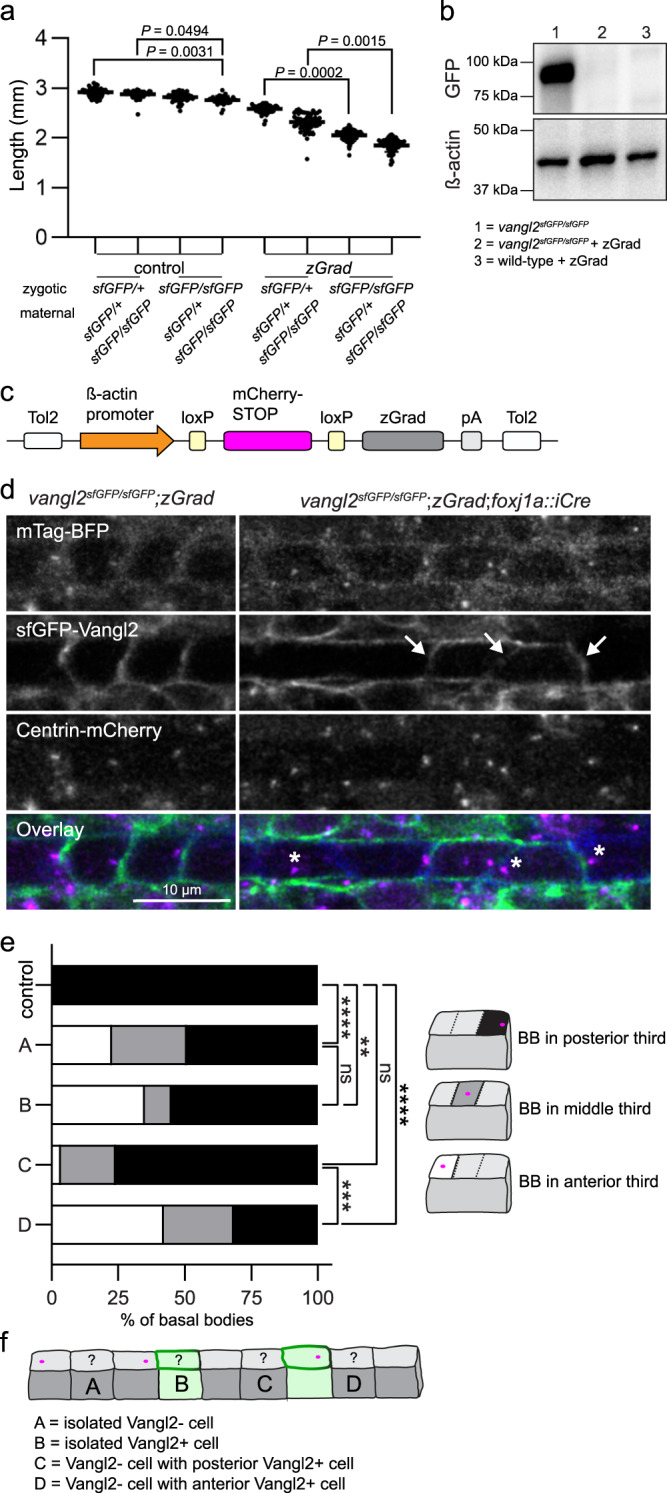
Fig. 5
a Quantification of embryo lengths for zGrad mRNA-injected and control embryos at 24 hpf. Maternal and zygotic genotypes are as indicated. Data is pooled from three independent experiments. Control n from left to right: n = 53, n = 62, n = 61, n = 36. zGrad n from left to right: n = 55, n = 51, n = 53, n = 54. Horizontal line labels mean, and dots indicate individual embryo measurements. Statistical analysis was performed using Kruskal-Wallis test with Dunn’s multiple comparisons test. Source data are provided as a Source Data file. b A representative Western blot detecting sfGFP-Vangl2 protein levels using a GFP antibody in uninjected vangl2 sfGFP/sfGFP embryos and vangl2sfGFP/sfGFP or wild-type embryos injected with 50 pg of zGrad mRNA. β-acting is used as a loading control. N = 3; 50 uninjected vangl2 sfGFP/sfGFP, 50 zGrad injected wild-type, and 70 zGrad injected vangl2 sfGFP/sfGFPembryos were lysed per sample. c A schematic of the conditional zGrad transgene. d Live confocal images of sfGFP-Vangl2 expression in relation to basal body (Centrin-mCherry) and membrane (mTagBFP) reporters within floorplate cells of control vangl2 sfGFP/sfGFP;Tg(βactin2::loxP-mCherry-STOP-loxP-zGrad) embryos (left) and experimental vangl2 sfGFP/sfGFP;Tg(βactin2::loxP-mCherry-STOP-loxP-zGrad);Tg(foxj1a::iCre) embryos (right) at 48 hpf. Dorsal view, anterior to the left. Arrows indicate residual sfGFP-Vangl2 expression in a subset of floorplate cells following zGrad expression. Asterisks indicate mispolarized basal bodies following zGrad expression. e Quantification of basal body localization within the posterior, medial or anterior thirds of floor plate cells for control and vangl2 sfGFP/sfGFP;Tg(βactin2::loxP-mCherry-STOP-loxP-zGrad);Tg(foxj1a::cre) embryos described in b. Cells were categorized as A-D based on the presence or absence of sfGFP-Vangl2 signal within both the cell and its immediate neighbours, as illustrated in f. Control, n = 164; A, n = 256; B, n = 20; C, n = 29; D, n = 19. Statistical analysis was performed using Kruskal-Wallis test with Dunn’s multiple comparisons test. Source data are provided as a Source Data file. f A schematic illustrating cell categories quantified in e. Grey colour indicates cells that have lost sfGFP-Vangl2 signal; green colour indicates residual sfGFP-Vangl2 expression.