
|
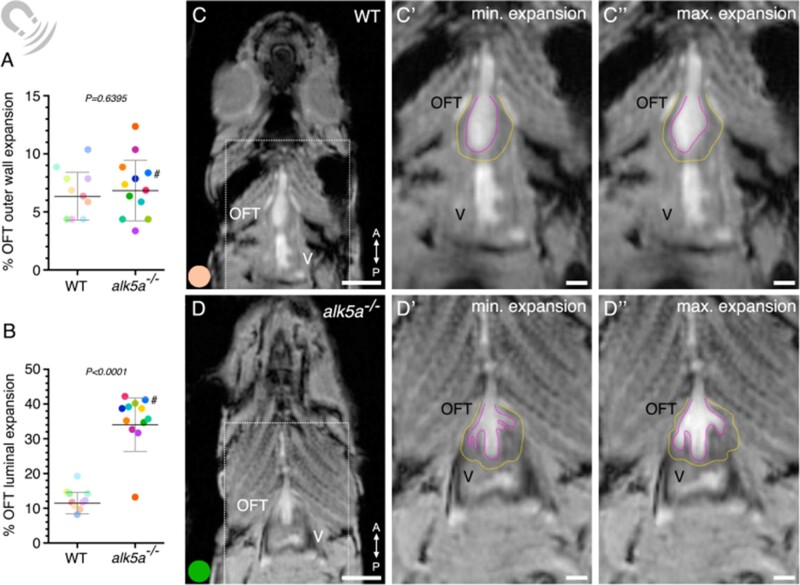
Fig. 3
MRI analyses of beating hearts reveal increased OFT luminal dilation in alk5a–/– adult zebrafish. (A, B) Percentage of OFT outer wall (A) and luminal (B) expansion in WT (n = 10) and alk5a–/– (n = 12) adult zebrafish. Plots show the values for each individual and the mean ± SD; P-values were determined by unpaired t-test (A) or Mann–Whitney test (B). (C–D”) Single frames of MRI cines of WT (C–C”) and alk5a–/– (D–D”) zebrafish in coronal view. Boxed area is shown in C’, D’ (minimum expansion OFT) and C”, D” (maximum expansion OFT). Magenta dashed line, OFT lumen; yellow dashed line, OFT outer wall. The colour of each dot refers to the same zebrafish across all graphs and images. The dot adjacent to the number symbol (#) identifies the individual zebrafish mentioned in the text. OFT, outflow tract; V, ventricle. Scale bars: 1.5 mm (C, D), 500 µm (C’, C”, D’, D”).