
Image
|
Figure Caption
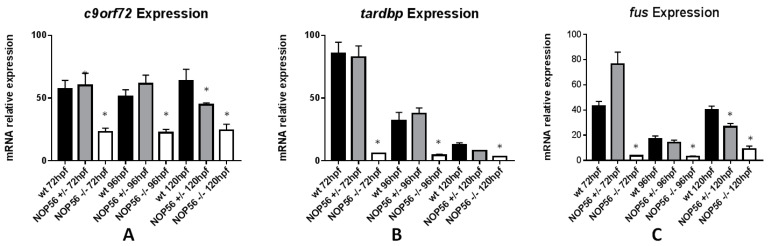
Fig. 14
Graphic representation of mRNA expression analysis by RT-qPCR. (A) c9of72 expression is significantly reduced in nop56−/− embryos between 72 and 120 hpf (p-value < 0.001) and in nop56+/− at 120 hpf (p-value=0.0015). (B) tardbp expression is significantly reduced in nop56−/− embryos between 72 and 120 hpf (p-value < 0.001). (C) fus expression is significantly reduced in nop56−/− embryos between 72 and 120 hpf (p-value < 0.0001) and in nop56+/− embryos at 120 hpf (p-value < 0.0001). Statistically significant data in the graphs are indicated with a *.
Figure Data
Acknowledgments
This image is the copyrighted work of the attributed author or publisher, and
ZFIN has permission only to display this image to its users.
Additional permissions should be obtained from the applicable author or publisher of the image.
Full text @ Biomedicines