
Image
|
Figure Caption
Fig. 9
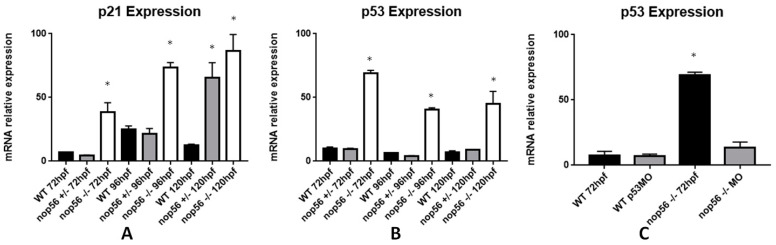
Graphic representation of analysis of mRNA expression by RT-qPCR. (A) p21 expression is significantly higher in nop56−/− larvae between 72 and 120 hpf (p-value < 0.0001.) (B) p53 expression is significantly higher in nop56−/− larvae between 72 and 120 hpf (p-value < 0.0001.) (C) Microinjection of p53 morpholino restored the expression in nop56−/− embryos to levels similar to wild type but not the malformations (data not shown). Statistically significant data in the graphs are indicated with a *.
Figure Data
Acknowledgments
This image is the copyrighted work of the attributed author or publisher, and
ZFIN has permission only to display this image to its users.
Additional permissions should be obtained from the applicable author or publisher of the image.
Full text @ Biomedicines