
|
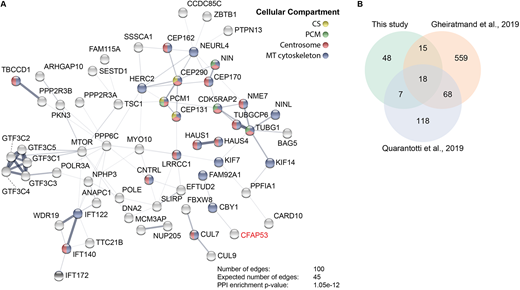
Fig. 3 Cfap53 interacts with centrosomal, centriolar satellite and microtubule-associated proteins. (A) Network analysis using String-DB (Szklarczyk et al., 2015) from proteins identified by MS analysis after streptavidin-based purification using CFAP53 as bait. Only high-confidence hits from the MS dataset were used, which were obtained via stringent filtering steps on raw data (see Materials and Methods). Proteins shown are those with a significantly higher number of edges (representing protein-protein associations) than that expected stochastically. The thickness of the lines between the nodes does not represent strength or specificity of a given interaction, but represents the approximate confidence on a scale from zero to one of a found association being true, given the available evidence. Node colors represent cellular compartment of the indicated protein. (B) Venn diagram showing number of proteins identified in this study by bioGFP-Cfap53 pulldown with MS analysis overlapping with the centriolar satellite proteins that were identified by Gheiratmand et al. (2019) and Quarantotti et al. (2019).