
|
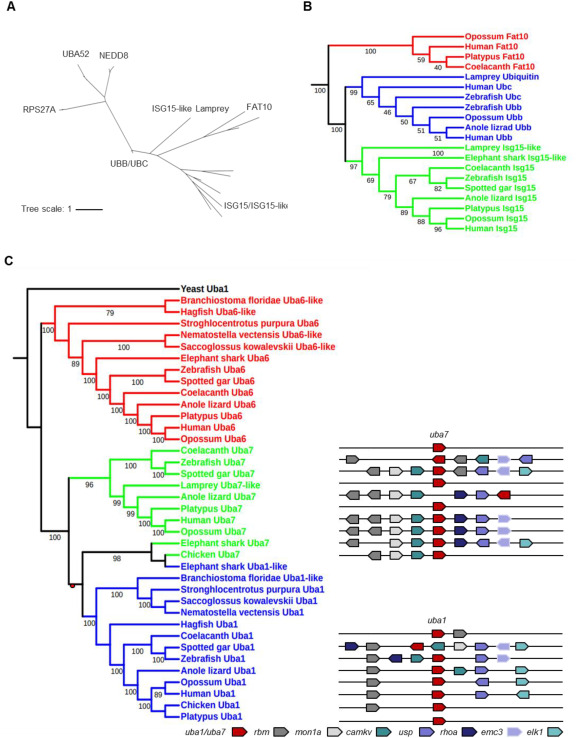
Fig. 1 Fig. 1. Phylogeny of ISG15 and UBA7. (A) Phylogenetic tree analyses of the ubiquitin family (ISG15, NEDD8, FAT10, UBA52, RPS27A, and UBB/UBC). The phylogenetic tree was constructed using amino acid multiple alignments generated by ClustalW and the maximum-likelihood method within the MEGA X program. The percentage of replicate trees in which the associated taxa clustered together in the bootstrap test (5000 replicates) is indicated. (B) Phylogenetic tree analyses of part of the ubiquitin family (ISG15, FAT10, and UBB/UBC). The phylogenetic tree was constructed as described in (A). (C) Phylogenetic (left) and syntenic (right) analyses for Uba1, Uba6, and Uba7. The phylogenetic tree, based on full-length amino acid sequences of Uba1, Uba6, and Uba7, was built using the maximum likelihood method with 5000 bootstrap replicates. Duplication nodes are shown as redcircle. A comparison of genomic synteny between UBA1 and UBA7 is shown on the right, with orthologs of each gene given in the same color. The genes are represented by block arrows whose directions indicate their orientation.