
Image
|
Figure Caption
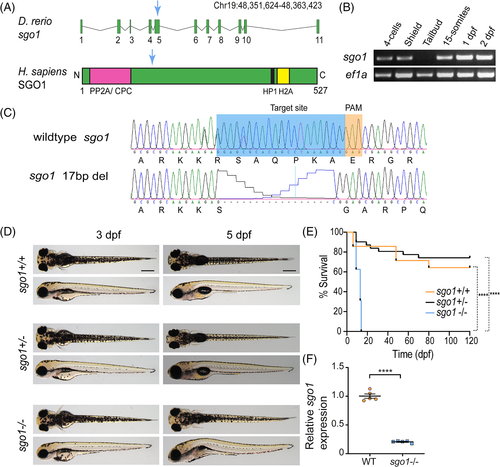
Fig. 1
The generation of sgo1 mutant in zebrafish. (A) sgo1 transcript in zebrafish (Danio rerio) displaying the exons and intron regions. Human (Homo sapiens) SGO1 protein, containing 527 amino acids, and binding regions: protein phosphatase 2 (PP2A), chromosome passenger complex (CPC), heterochromatin protein 1 (HP1), and histone H2A (H2A). Blue arrow shows the location of the generated mutant in exon 5. (B) RT-PCR for sgo1 and ef1a (control) at various developmental stages. (C) CRISPR/Cas9 design for the introduction of a loss-of-function mutation in sgo1. The mutated sequence shows a 17 bp deletion in exon 5, resulting in an early stop in the mutated sequence and truncation of the protein (not shown). (D) Top and side images of 5 dpf larvae of sgo1−/−, sgo1+/− and their wild-type siblings. (E) Kaplan–Meier curve, displaying the survival of sgo1 −/−, sgo1+/− and their wild-type siblings during the first 120 dpf of development (sgo1+/+ n = 14, sgo1+/− n = 30, sgo1−/− n = 16). (F) Levels of sgo1 expression in sgo1 mutant embryos (n = 5) in comparison with wild type siblings (n = 5). Statistics: (E) Log-rank (Mantel–Cox) test, mean ± SEM; (F) Two-tailed nonpaired Student's t-test, mean ± SD; P ≤ .0001. Scale bars is at 200 μm. bp: base pairs, PAM: protospacer adjacent motif, dpf: days post fertilization
Figure Data
Acknowledgments
This image is the copyrighted work of the attributed author or publisher, and
ZFIN has permission only to display this image to its users.
Additional permissions should be obtained from the applicable author or publisher of the image.
Full text @ Dev. Dyn.