IMAGE

Fig. 3

ID
ZDB-IMAGE-220722-4
Source
Figures for Rusnati et al., 2021
Image
Figure Caption

Fig. 3 Effect of UniPR1331 on VEGFR2 activation.

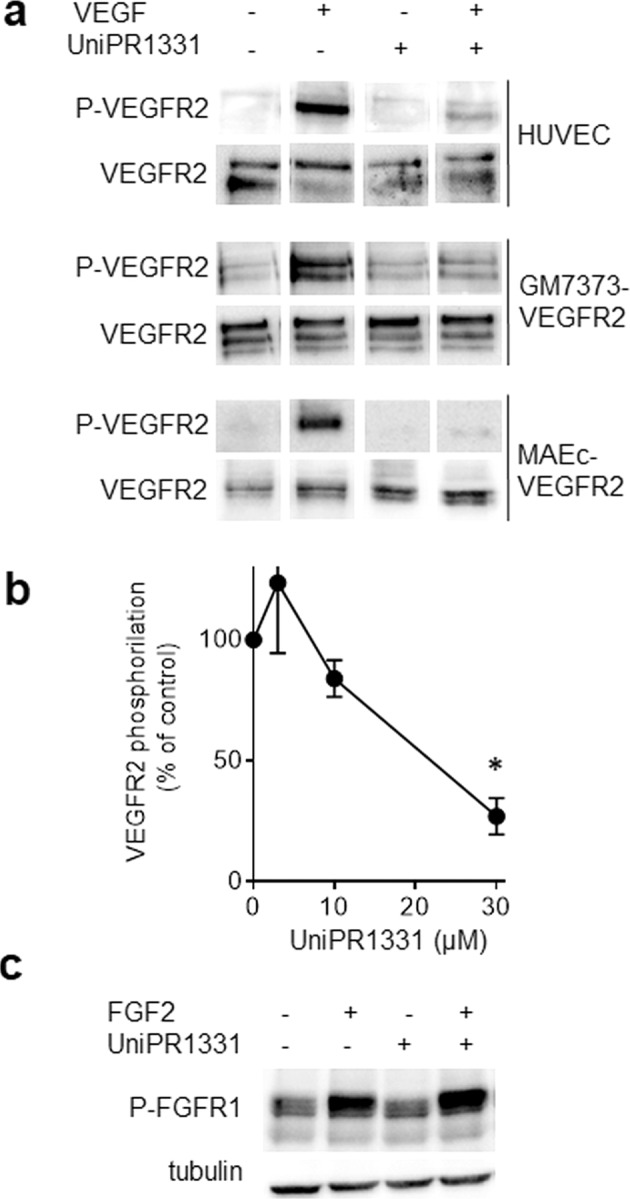
The indicated cells were left unstimulated or stimulated with 10 ng/ml VEGF (a, b) or 30 ng/ml FGF2 (c) with UniPR1331 (30 μM in ac or increasing concentrations in b). Then, cells were analyzed by WB with anti-P-VEGFR2 (a, b) or anti-P-FGFR1 (c) antibody. Uniform loading was confirmed with anti-VEGFR-2 or anti-tubulin antibody. The results shown are representative of other two that gave similar results. The single lanes have been cropped and reorganized for an easy comparison. b Densitometric quantification of P-VEGFR2 immunoreactive bands normalized to the expression levels of VEGFR2. (mean ± S.E.M. of three independent experiments, *P < 0.005).

Acknowledgments
This image is the copyrighted work of the attributed author or publisher, and ZFIN has permission only to display this image to its users. Additional permissions should be obtained from the applicable author or publisher of the image. Full text @ Cancer Gene Ther.