
Image
|
Figure Caption
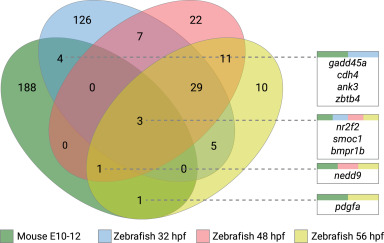
Fig. 1 Figure 1. Venn diagram of the significantly regulated genes identified in mouse and zebrafish optic fissure developmental time points. The figure shows comparisons between differentially expressed gene lists of mouse and zebrafish optic fissure vs retinal tissue, with the numeric value indicating the number of genes at each intersection. Identified commonalities of genes are represented in each box, with colors representing each data set intersection. hpf, hours post fertilization.
Acknowledgments
This image is the copyrighted work of the attributed author or publisher, and
ZFIN has permission only to display this image to its users.
Additional permissions should be obtained from the applicable author or publisher of the image.
Full text @ Genet. Med.