
Image
|
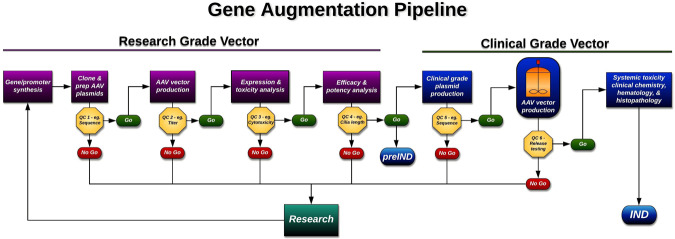
Figure Caption
Fig. 5
Schematic of therapeutic development pipeline described and followed in this study.
Using this strategy we were able to develop, test, and validate enough product to treat 500 patients (at a maximum clinical dose of 1 × 10¹¹v.g.) with MAK associated RP for less than $500,000 USD (i.e., ~$1000 USD/patient). v.g. = viral genomes. QC = quality control. Example QC analysis performed at each step is provided. For a complete list of QC analysis performed see Supplemental Table 3.
Acknowledgments
This image is the copyrighted work of the attributed author or publisher, and
ZFIN has permission only to display this image to its users.
Additional permissions should be obtained from the applicable author or publisher of the image.
Full text @ Gene Ther.