
Fig. 4
|
Fig. 4
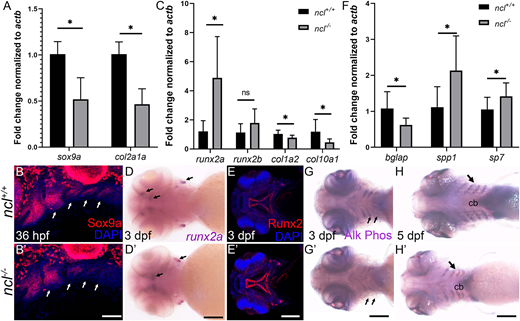
Chondrogenesis and osteogenesis defects in ncl−/− embryos. (A) qPCR revealed a significant downregulation of sox9a and col2a1 chondrogenesis markers in 36 hpf ncl−/− embryos compared with ncl+/+ embryos (n=10 per replicate). actb was used as a housekeeping control. (B,B′) Sox9a protein expression was significantly reduced in branchial arches 2-5 (white arrows) in ncl−/− embryos at 36 hpf (n=15). (C) qPCR of osteogenesis markers in 36 hpf ncl+/+ and ncl−/− embryos indicates significant upregulation in runx2a transcripts and downregulation in both col1a2 and col10a1 transcripts in ncl−/− embryos (n=10 per replicate). (D,D′) runx2a mRNA expression was significantly increased ncl−/− embryos at 3 dpf (n=15). Black arrows indicate expression of runx2a in the ceratohyal and otic vesicles. (E,E′) At 3 dpf, Runx2 protein expression was significantly increased in the palatoquadrate and the parasphenoid in ncl−/− embryos. (F) qPCR indicates a significant upregulation of the early osteoblast markers bglap and spp1 and downregulation of the late osteoblast marker sp7 in 36 hpf ncl−/− embryos compared with controls (n=10 per replicate). (G-H′) Alkaline phosphatase staining of ncl+/+ and ncl−/− embryos reveals reduced staining in the lower jaw (ventral view, black arrows) at 3 dpf (G,G′) and 5 dpf (H,H′) (n=15). All experiments were performed three times. cb, ceratobranchial. Scale bars: 200 µm (B,B′); 100 µm (D-E′,G,G′); 140 µm (H,H′). Data are represented as mean±s.d. ns, not significant; *P<0.05 (two-tailed, paired Student's t-test).