
|
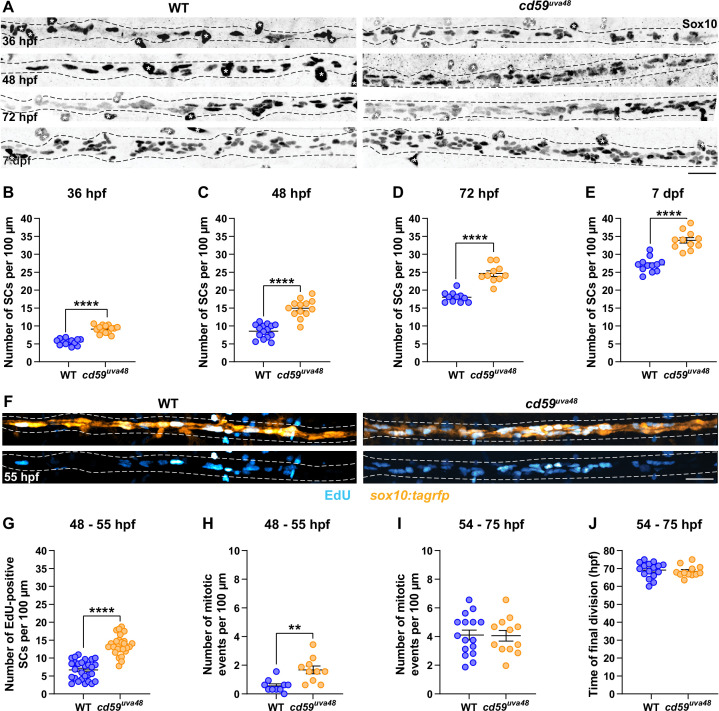
Fig. 4
(A) Immunofluorescence (IF) showing Sox10-positive SCs (black/gray) along the posterior lateral line nerve (pLLN) from 36 hours post fertilization (hpf) to 7 days post fertilization (dpf). Black dashed lines outline the pLLN. Sox10-positive pigment cells outside of the dashed lines (white asterisks) were not included in the analysis. (B–E) Scatter plots of the number of Sox10-positive SCs along the pLLN from 36 hpf to 7 dpf (mean ± SEM: 36 hpf: WT: 5.6 ± 0.2, cd59uva48: 9.1 ± 0.3; 48 hpf: WT: 8.6 ± 0.5, cd59uva48: 15.0 ± 0.7; 72 hpf: WT: 18.0 ± 0.4, cd59uva48: 24.3 ± 0.8; 7 dpf: WT: 27.0 ± 0.6, cd59uva48: 33.9 ± 0.8; p-values: p<0.0001; dot = 1 fish). (F) EdU incorporation assay showing sox10:tagrfp-positive, pLLN SCs (orange) pulsed with EdU (cyan) from 48 to 55 hpf. (G) Scatter plot of the number of EdU-positive SCs along the pLLN at 55 hpf (WT: 6.7 ± 0.5, cd59uva48: 13.6 ± 0.5; p<0.0001; dot = 1 fish). (H) Scatter plot of the number of mitotic events observed in SCs from 48 to 55 hpf (mean ± SEM: WT: 0.6 ± 0.1, cd59uva48: 1.7 ± 0.3; p=0.0019; dot = 1 fish). (I) Scatter plot of the number of mitotic events observed in SCs from 54 to 75 hpf (mean ± SEM: WT: 4.1 ± 0.3, cd59uva48: 4.1 ± 0.4; dot = 1 fish). (H) Scatter plot of the time of final cell division (hpf) observed in SCs from 54 to 75 hpf (mean ± SEM: WT: 69.1 ± 1.1, cd59uva48: 68.4 ± 0.9; dot = 1 fish). All data were collected from somites 11–13 (~320 µm) and normalized to units per 100 µm. All images in this figure were acquired with confocal imaging. Each dataset was compared with Student’s t-test using GraphPad Prism. Scale bars: (A, F) 25 µm.