
|
Fig. 2
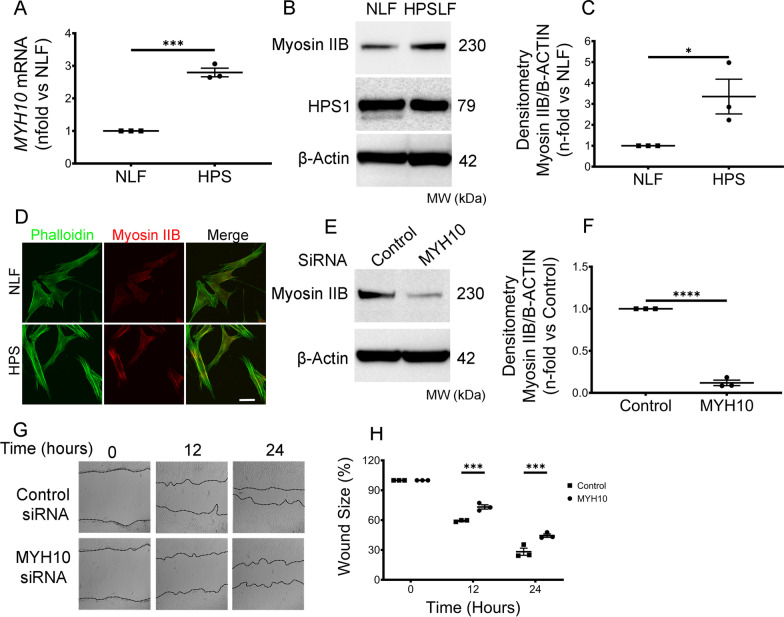
Enhanced migration of HPSLF is Myosin IIB dependent. A Real-time PCR analysis of MYH10 mRNA in NLF (n = 3 technical replicates) and HPSLF (n = 3 technical replicates). Results were expressed as fold change relative to NLF. B Western blot analysis of Myosin IIB and HPS1. Protein expression in control NLF and HPSLF cells are shown; β-Actin was used as a loading control. C Ratio of Myosin IIB to β-Actin density expressed as fold-change relative to control NLF. D Immunofluorescent images of NLF and HPSLF stained with Phalloidin (green) and Myosin IIB (red). E Western blot analysis of Myosin IIB protein expressions in HPSLF transfected with either control or MYH10 siRNA. β-Actin was used as a loading control. F Ratio of Myosin IIB to β-Actin density expressed as fold-change relative to control siRNA. G Representative microscopy images of scratch assays at 0, 12, and 24 h after gaps were generated in control or MYH10 siRNA transfected HPSLF. H Quantitative analysis of the migration potential of control or MYH10 siRNA transfected HPSLF. The rate of fibroblast migration was determined by calculating the percentage of open wound area at the indicated time points to that of the corresponding initial scratch. Data are expressed as mean ± SEM of three independent experiments. A, B, E Data were analyzed using students t-test *P < 0.5, ***P < 0.001, ****P < 0.0001. G Data were analyzed using two-way mixed ANOVA ***P < 0.001