IMAGE

Figure 2

ID
ZDB-IMAGE-220509-23
Source
Figures for Connor et al., 2022
Image
Figure Caption

Figure 2

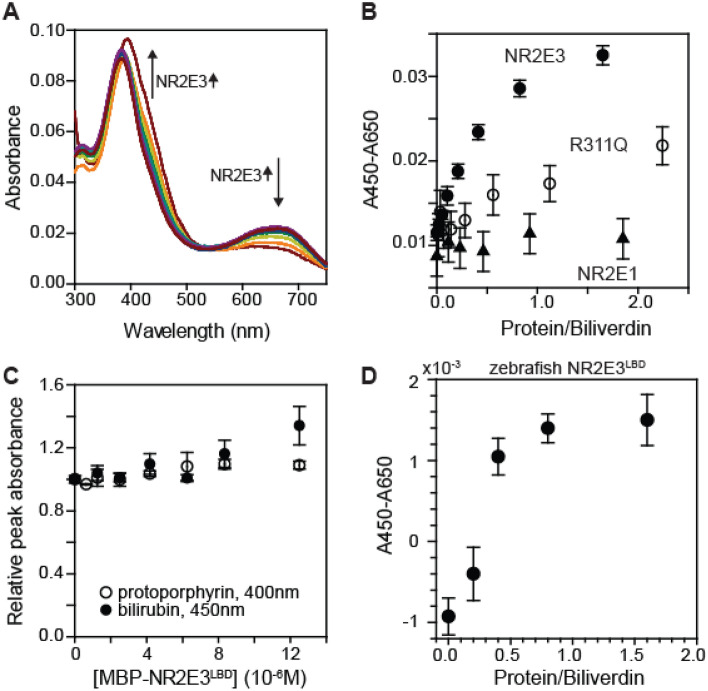
Biliverdin specifically binds to MBP-NR2E3LBD in vitro. (A) Visible spectra of biliverdin (5 μM) in the absence and in the presence of varying amounts of MBP-NR2E3LBD. The blue peak shifts from 390 to 450 nm, while the red peak intensity diminishes upon binding to MBP-NR2E3LBD. (B) Biliverdin stoichiometrically bound to MBP-NR2E3LBD (filled circle). MBP-NR2E3LBD R311Q variant (open circle) showed a weaker binding to biliverdin (5 μM). MBP-NR2E1LBD (triangle) did not show any evidence of binding to biliverdin. Averages and standard deviations (n = 3) are presented. (C) Effect of MBP-NR2E3LBD on visible spectra of (filled circle) bilirubin and (open circle) protoporphyrin IX (average and standard deviations, n = 3). (D) Effect of MBP-zebrafish NR2E3LBD to the visible spectrum of biliverdin (average and standard deviations, n = 3). The concentration of biliverdin was identical to the one used in Fig. 2A, B.

Acknowledgments
This image is the copyrighted work of the attributed author or publisher, and ZFIN has permission only to display this image to its users. Additional permissions should be obtained from the applicable author or publisher of the image. Full text @ Sci. Rep.