
|
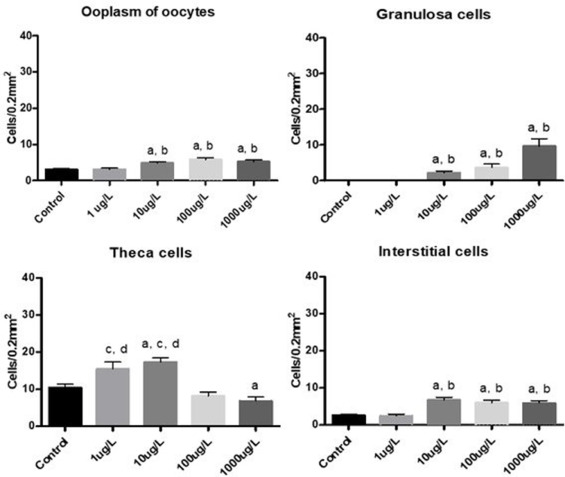
Fig. 3 Response of cyp19a1a expression in the zebrafish ovary after exposure to different BPA concentrations. Means ± standard errors of the ooplasm of oocytes, as well as granulosa, theca and interstitial cells immunopositive for cyp19a1a in the ovary from control zebrafish and groups exposed to 1, 10, 100 and 1000 μg/L of BPA (n = 6 per group). asignificant differences vs control (p<0.05); bsignificant differences vs 1 μg/L (p<0.05); csignificant differences vs 100 μg/L (p<0.05); dsignificant differences vs 1000 μg/L (p<0.05) (Kruskal-Wallis test followed by Dunn's multiple comparisons test for non-parametric distributions).