
|
Figure 6
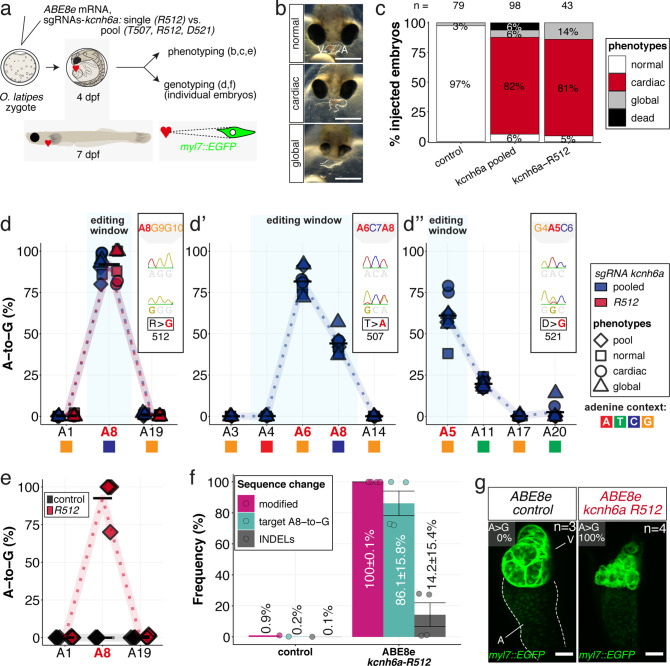
(a) Regime of ABE8e mRNA injections with a single (kcnh6a-R512) or pooled sgRNAs (kcnh6a-T507, -R512, -D521) targeting different amino acid codons in the voltage sensor S4 domain/S4-S5 linker of the medaka potassium channel ERG in myl7::EGFP (Cab strain) transgenic embryos; control injection included ABE8e mRNA only. (b) Phenotypes in F0 comprised primary cardiac malformation (dysmorphic ventricle with impaired contractility) and more severe global phenotypes with general retarded development and prominently dysmorphic hearts the proportions of which are given in (c). Scale bar = 400 µm. (d-d'') Genotyping summaries of the three sgRNA loci with phenotype class annotations for each genotyped specimen with a comparison of single sgRNA-R512 injection to a pool with two additional sgRNAs (T507 and D521) targeting the medaka ERG S4 voltage sensor; inlets display Sanger reads with the editing of A8 (d), A6 and A8 (d') and A5 (d'') contained in the core editing windows; sgRNA pool (n = 8) and sgRNA-R512 (n = 6). To highlight the dinucleotide context, the nucleotide preceding the target A is shown by red (A), green (T), blue (C) and yellow (G) squares below the respective A. (e–g) Confocal microscopy of the heart in a myl7::EGFP reporter line injected with ABE8e mRNA and sgRNA-R512 at 7 dpf reveals significant chamber wall defects of non-contractile/spastic ventricles with A-to-G editing of 100% in 3/4 of the specimen as determined by Sanger sequencing (e). (f) Amplicon-seq of the same gDNA samples (single embryos, n = 4) quantified target A8-to-G editing and indel frequencies. Aligned Illumina-reads analyzed, 11,387 (control); 24,936 (ABE8e rep1); 4038 (ABE8e rep2); 75,148 (ABE8e rep3); 86,327 (ABE8e rep4). Images show maximum z-projections of optical slices acquired with a z-step size of 1 µm (g). Note the display of A-to-G conversion rates. Scale bar = 50 µm. V = ventricle, A = atrium, dpf = days post fertilization.
In vivo modeling of human LQTS-associated mutations using adenine base editing of the medaka ERG channel gene kcnh6a.