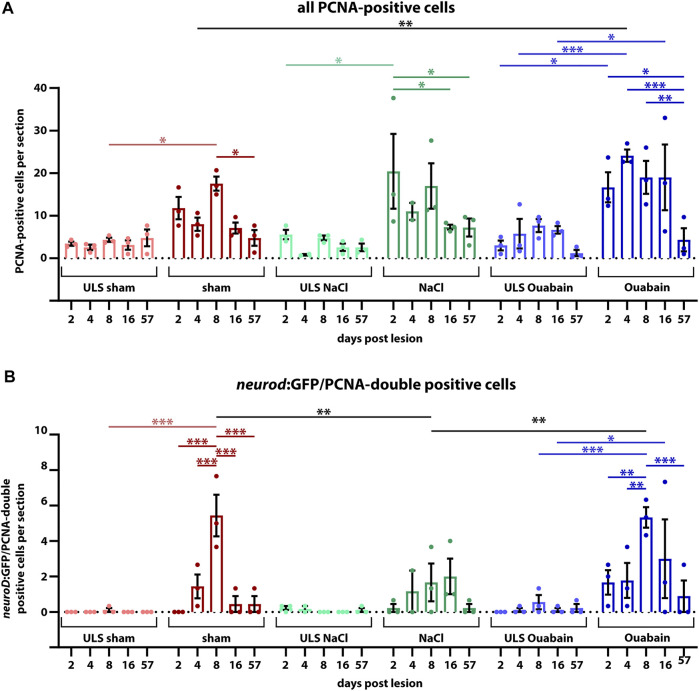
IMAGE

FIGURE 5

ID
ZDB-IMAGE-220406-52
Source
Figures for Schwarzer et al., 2022
Image
Figure Caption

FIGURE 5

Quantification of reactive proliferation of neurod:GFP-positive progenitors. (A) Quantification of all PCNA-positive cells. Compared with the respective SAGs of unlesioned sides (ULS sham, ULS NaCl, ULS Ouabain), the number of PCNA-positive cells per section is increased following sham treatment, or NaCl or ouabain injections in the first 8 days post lesion (dpl). An even significant increase compared with the unlesioned side is present at 2 dpl following NaCl injection, at 4 dpl following ouabain injection and at 8 dpl following sham treatment, respectively. At 57 dpl, the proliferation rate in the lesioned SAG was significantly decreased to the levels of the unlesioned side. (B) Quantification of neurod:GFP/PCNA double-positive cells. Compared with the respective SAGs of unlesioned sides, the number of neurod:GFP-positive cells per section that re-enter the cell cycle is increased following sham treatment, or NaCl or ouabain injections. The peak of proliferation of active cycling neuronal progenitors is observed at 8 dpl with a significantly increased number of five to six neurod:GFP/PCNA double-positive cells per section in sham-treated and ouabain-injected SAGs. The number of proliferating neurod:GFP neuronal progenitors is significantly lower in NaCl-injected SAGs compared with sham-treated and ouabain-injected SAGs at 8 dpl. However, changes in the overall proliferation rate in NaCl-injected SAGs follow a similar trend as seen in sham-treated and ouabain-injected SAGs. The number of neurod:GFP/PCNA double-positive cells per section has significantly decreased at 16 and 57 dpl in sham-treated and ouabain-injected SAGs, respectively, although a small number of lesioned animals still showed low numbers of neurod:GFP/PCNA double-positive cells in each lesion type. Notably, neurod:GFP/PCNA double-positive cells were infrequently also observed in the unlesioned side, in particular, in ouabain-injected animals, in which an average of 0.5–1 neurod:GFP/PCNA double-positive cells per section was seen. Samples size n = 3 (n = fish with three sections/SAG; exception: 4 dpl/NaCl: n = 2); data are presented as mean ± SEM. Two-way ANOVA with Tukey’s multiple comparisons test; ***≤ 0.001; **≤ 0.01; *≤ 0.05.

Acknowledgments
This image is the copyrighted work of the attributed author or publisher, and ZFIN has permission only to display this image to its users. Additional permissions should be obtained from the applicable author or publisher of the image. Full text @ Front Cell Dev Biol