IMAGE

FIGURE 3

ID
ZDB-IMAGE-220406-50
Source
Figures for Schwarzer et al., 2022
Image
Figure Caption

FIGURE 3

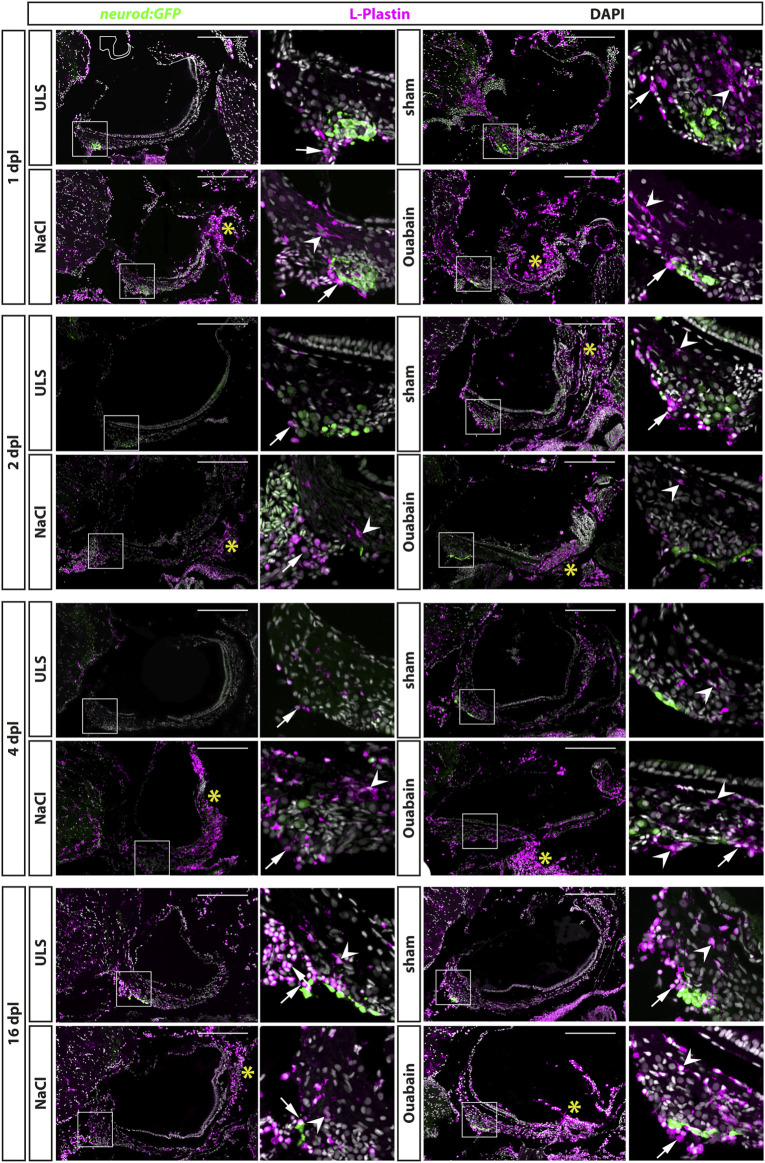
Accumulation of leukocytes in the adult zebrafish SAG upon lesion. Antibody staining against the pan-leukocyte marker L-plastin and GFP in the SAG of transgenic neurod:GFP zebrafish at 1, 2, 4, and 16 days post lesion (dpl). Shown are representative images of the SAG following sham-treatment, or NaCl or ouabain injections as well as the unlesioned side (ULS) of either sham-treated, or NaCl- or ouabain-injected animal. Boxes show close-ups of the respective neurod:GFP-positive neurogenic niche. In the unlesioned side (ULS, upper left panel in each time point), a few ramified L-plastin-positive cells are distributed evenly throughout the entire SAG. Some round, strong L-plastin-positive cells are localized in close contact to the neurogenic niche on the ventral side of the SAG (arrows). In contrast, accumulation of ramified L-plastin-positive cells (arrowheads) in the SAG is observed close to the neurogenic niche at all time points within sham-treated, or NaCl- or ouabain-injected SAGs (upper right and lower panels in each time point). In addition, the density of L-plastin-positive cells is usually the highest at the distal part of the SAG, especially when the sensory patch is massively destroyed as, for example, seen in 1 dpl/NaCl and ouabain, 2 dpl/ouabain, and 16 dpl/ouabain, irrespective of the lesion type (yellow asterisks). Scale bars: 200 µm.

Acknowledgments
This image is the copyrighted work of the attributed author or publisher, and ZFIN has permission only to display this image to its users. Additional permissions should be obtained from the applicable author or publisher of the image. Full text @ Front Cell Dev Biol