
|
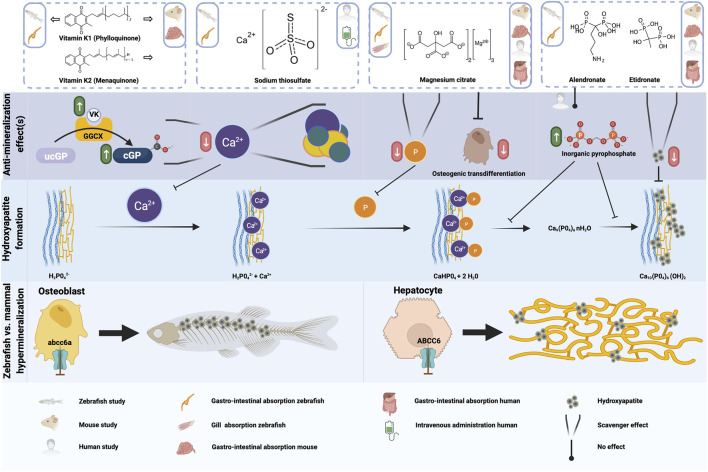
FIGURE 4
Schematic representation of the anti-mineralization effects of the tested compounds. For the compounds evaluated in the present study, the type of administration or absorption is mentioned in the top row, as well as the type of administration used in any mouse or human studies which were done with this compound. The anti mineralizing effects of the different compounds are shown, as well as where these effect take place in the cascade to form hydroxyapatite crystals. Finally, the differences between the hypermineralization in zebrafish and mammals with respect to abcc6a and ABCC6 deficiency are shown. Figure created with